

Net promoter score system and survey builder
- Role: Product Designer
- Duration: 4 months
- Year: 2019 - 2020
- Collaborations: Product Manager, Head of Design, Developers, Data Analysts
Initial goal
The goal was to build foundations of Revolut’s CRM system by firstly introducing a scalable mechanism allowing us to start capturing a higher volume of NPS survey responses. The NPS is for:
The company - capturing meaningful feedback from our customers and turning into actionable insights to continue improving our product and increase customer loyalty and retention.
The Customers - provide our customers with the opportunity to easily leave feedback for our product, so that they can feel as active participants in the product development process and see their valuable comments being addressed.
Product Owners - as we need to categorize any received feedback, so it is clearly shown for which product areas our customers would like to see further enhancements.
Marketing team - as we need to define to which group our users are falling into based on the provided rating (0 to 10), so our marketing team can plan to further approach each user group in an attempt to retain their loyalty and further upsell our services.
Customer success team - as we need to start actively communicating with any users, who demand further attention and show signs of higher probability to abandon our service.
Hypothesis Test: NPS Survey. Response Rate via Email for Different User Groups
We started off by testing a hypothesis. At Revolut we only used email for NPS surveys and we wanted to test in-email conversion rate. The hypothesis was that the in-email conversion rates for different user groups from time to onboard will give further evidence that in-email for NPS surveys is a channel where we can consistently expect low response rates.
We wanted to test this over a 4 day period by sending emails to users that have been onboarded for 7,14 or 28 days. Historically, we have only attempted to survey users that have been onboarded for 90,180, 270 etc. We will know the hypothesis is valid if the response rate for each user group is <10%, in-line with historical email response rates for users that onboarded 90 days ago
Survey
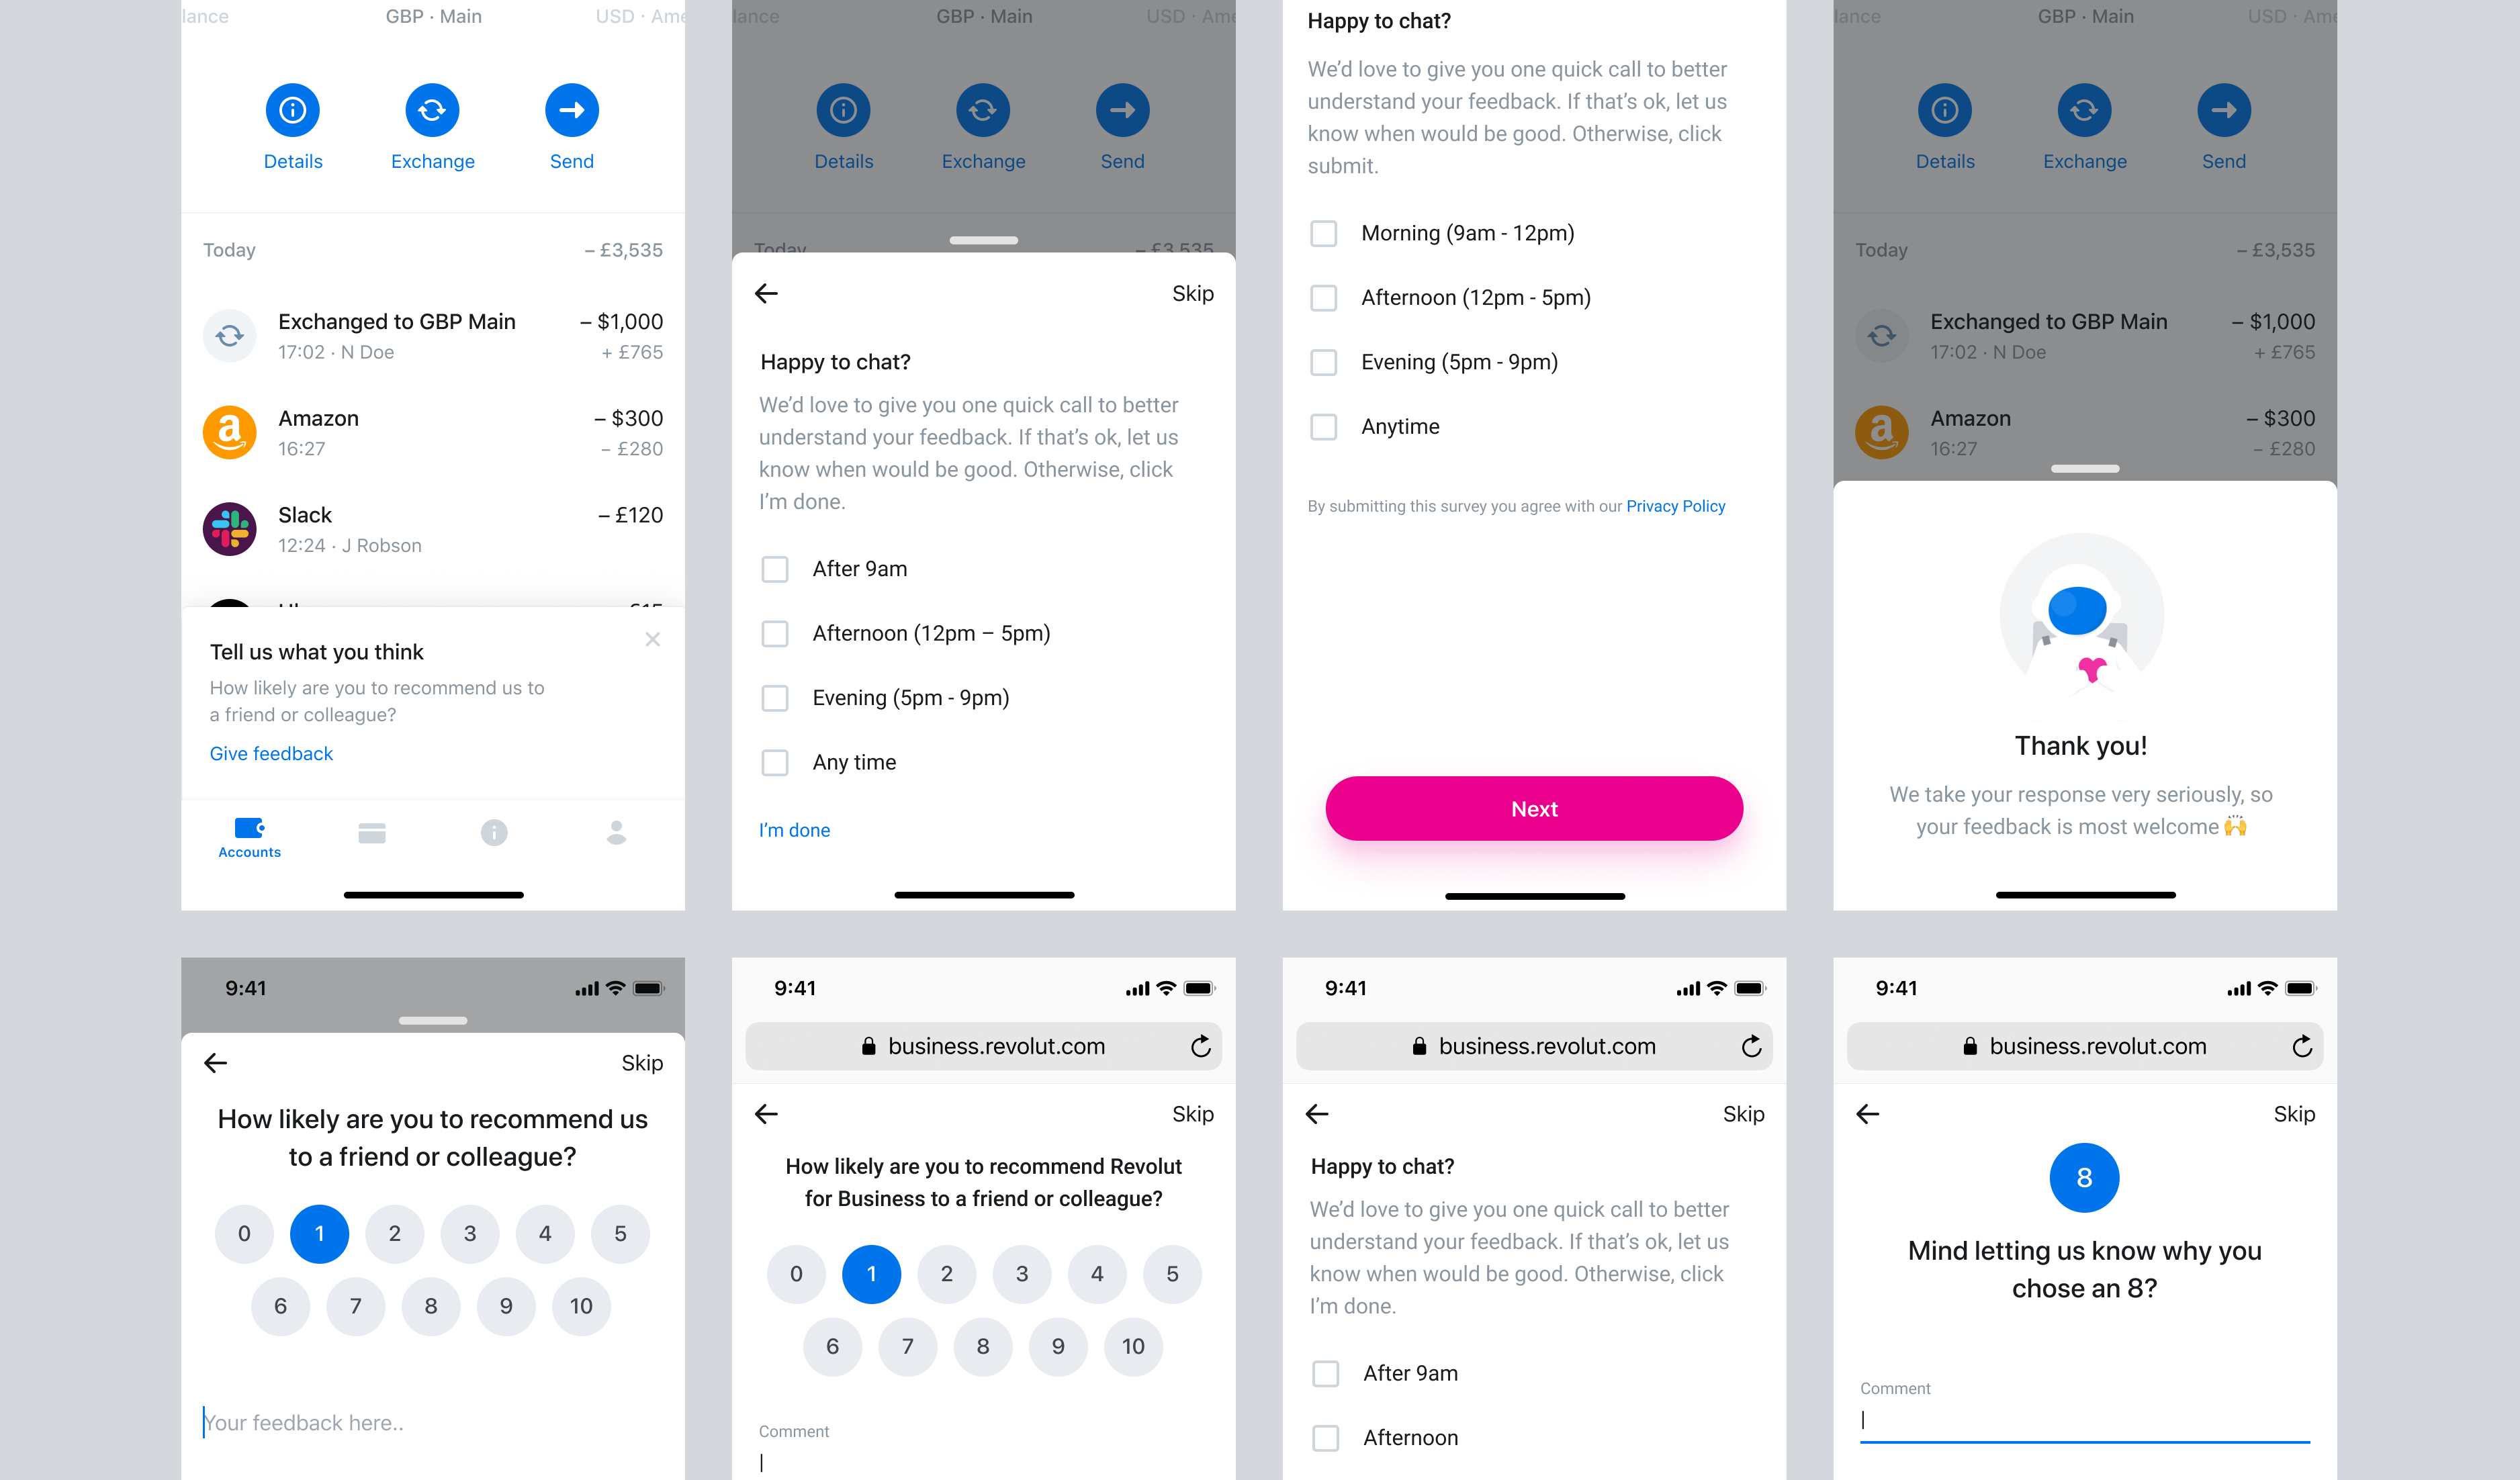
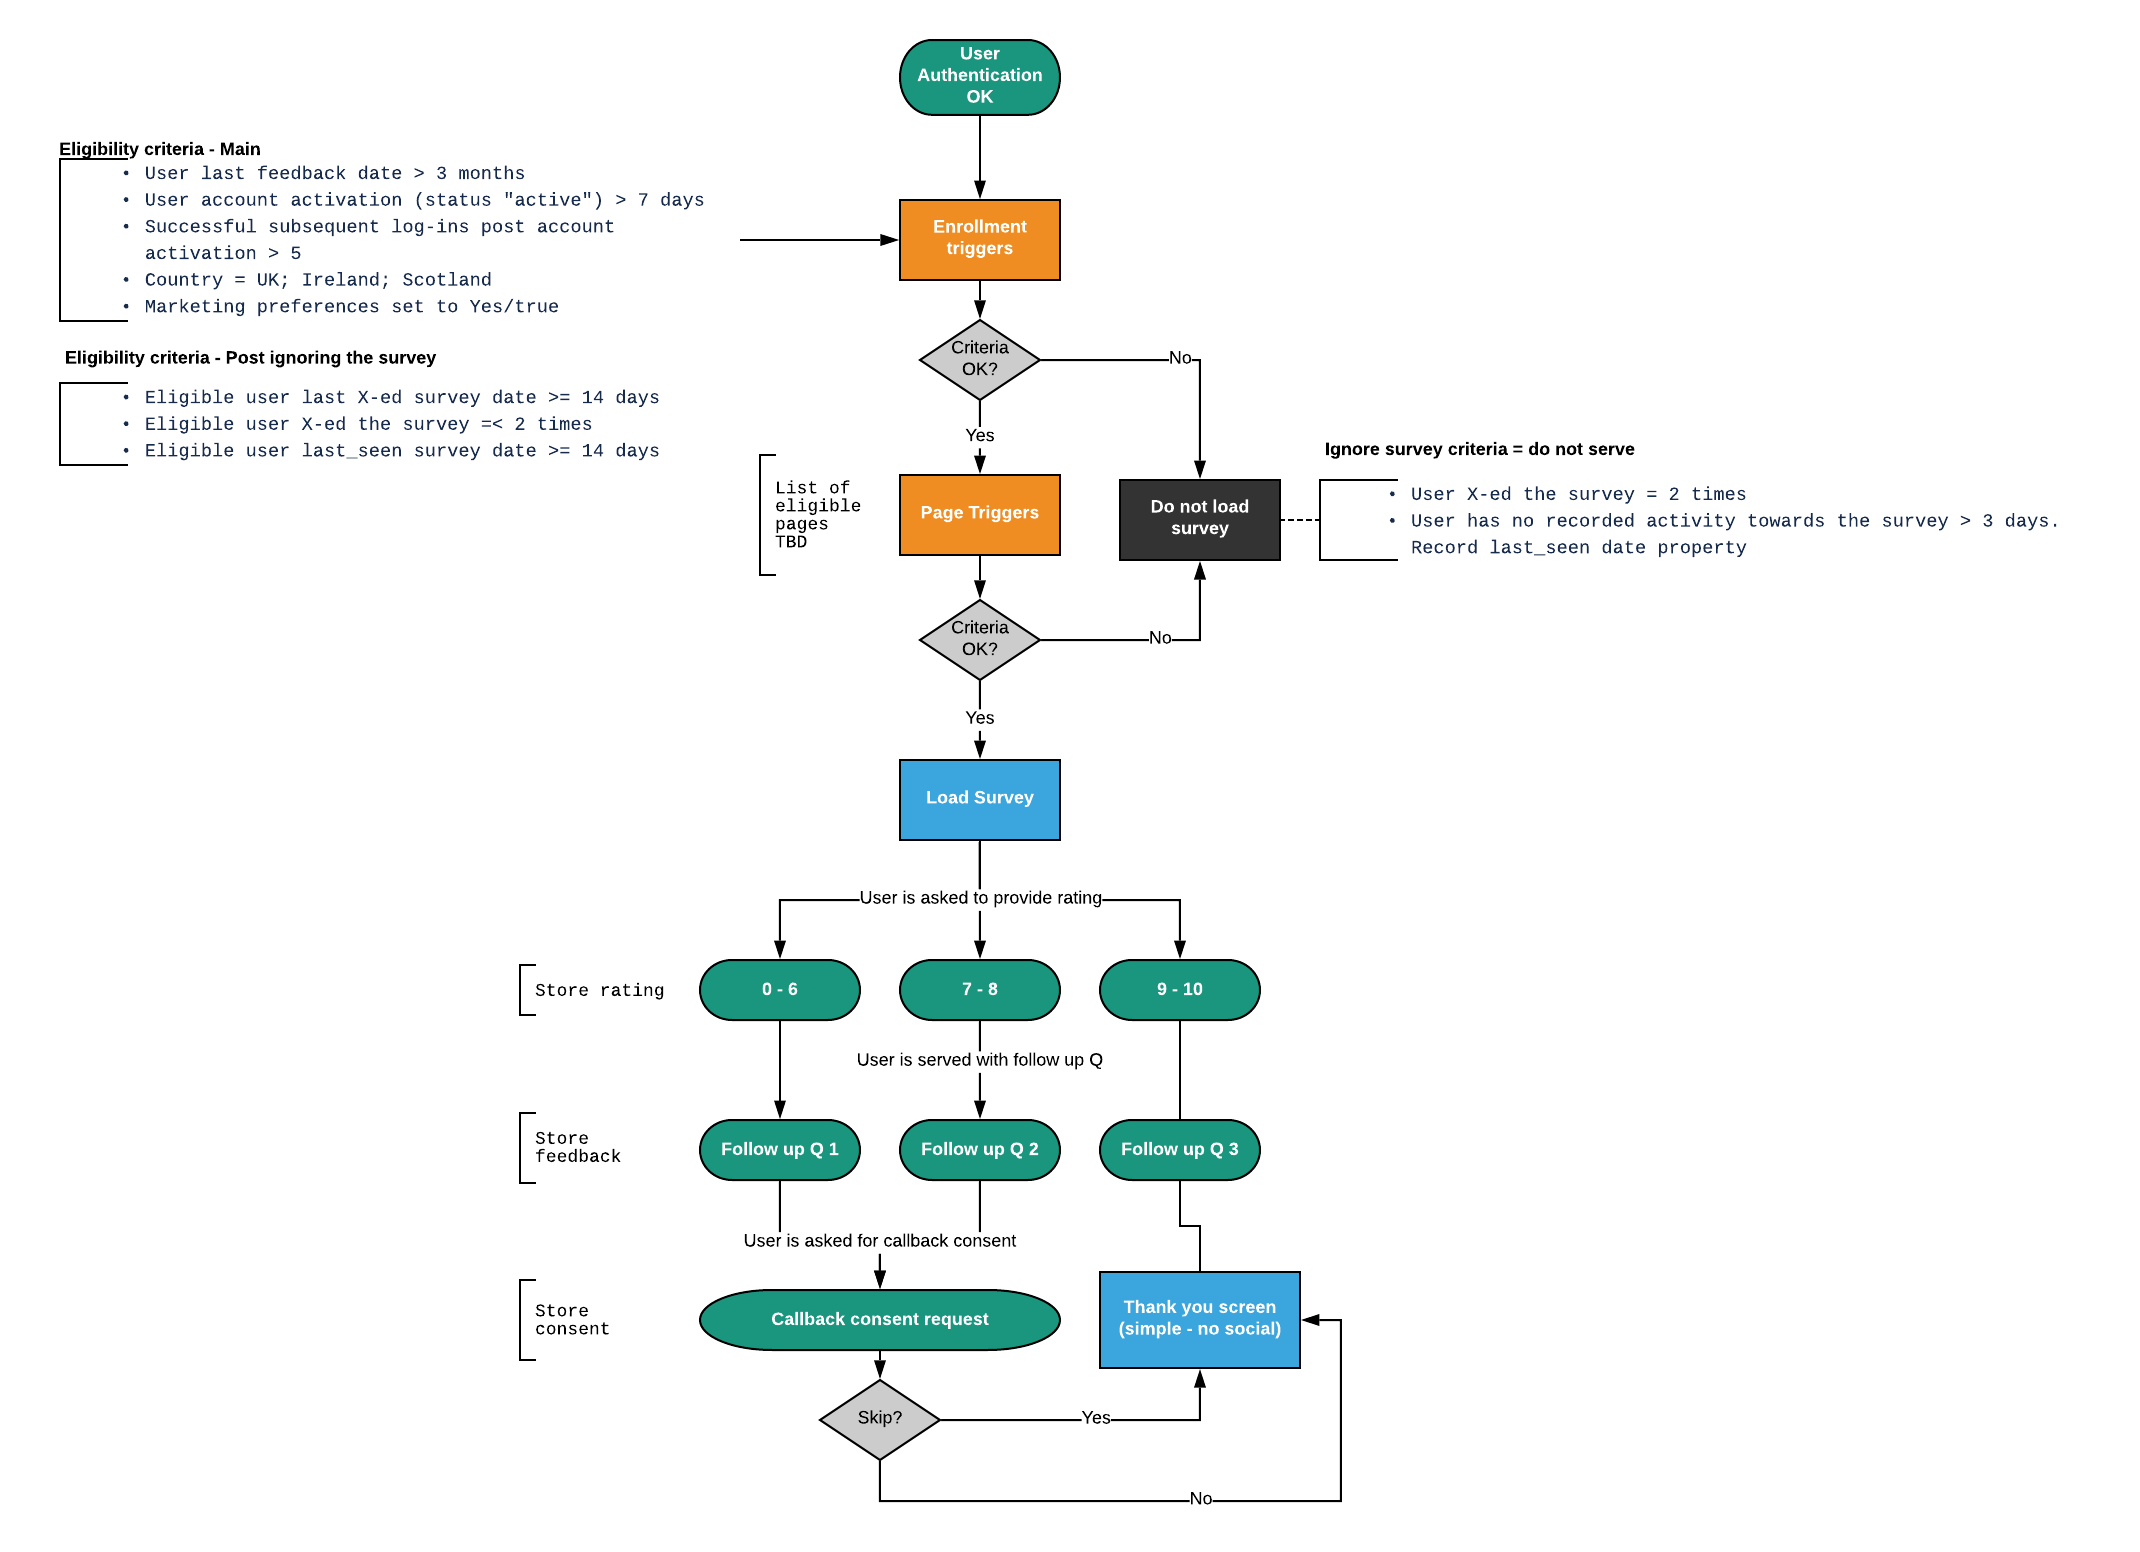
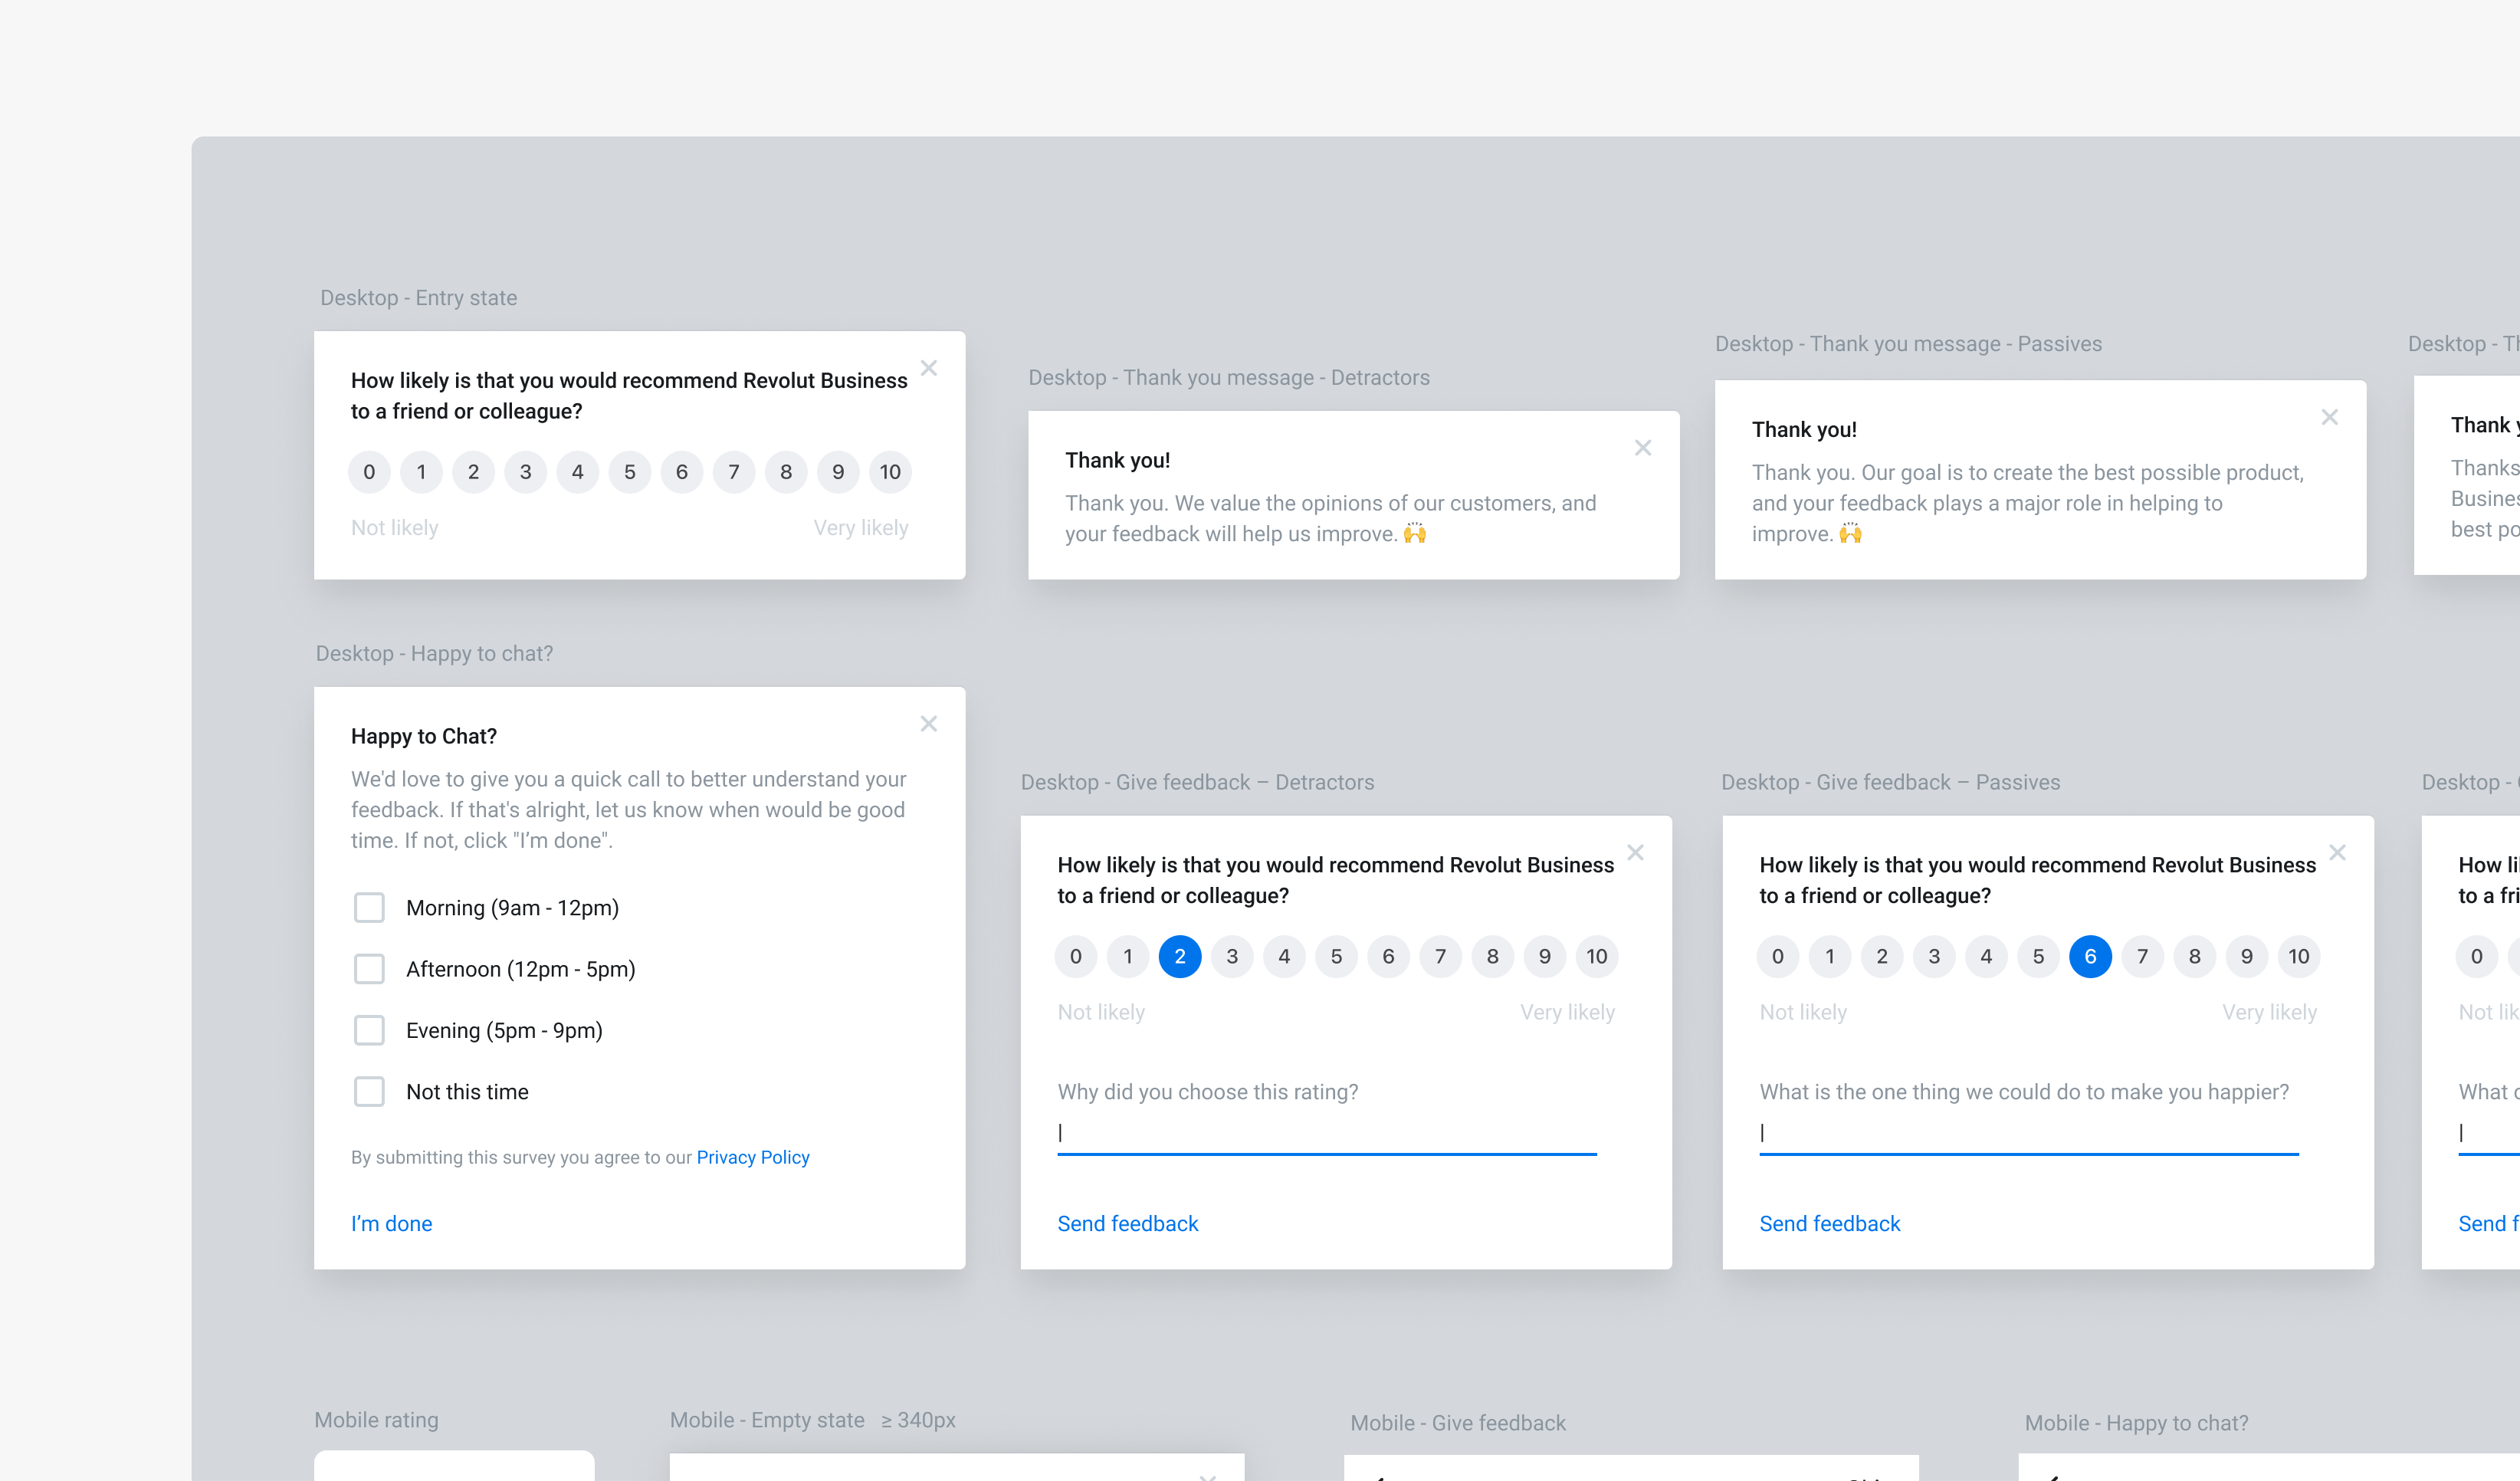
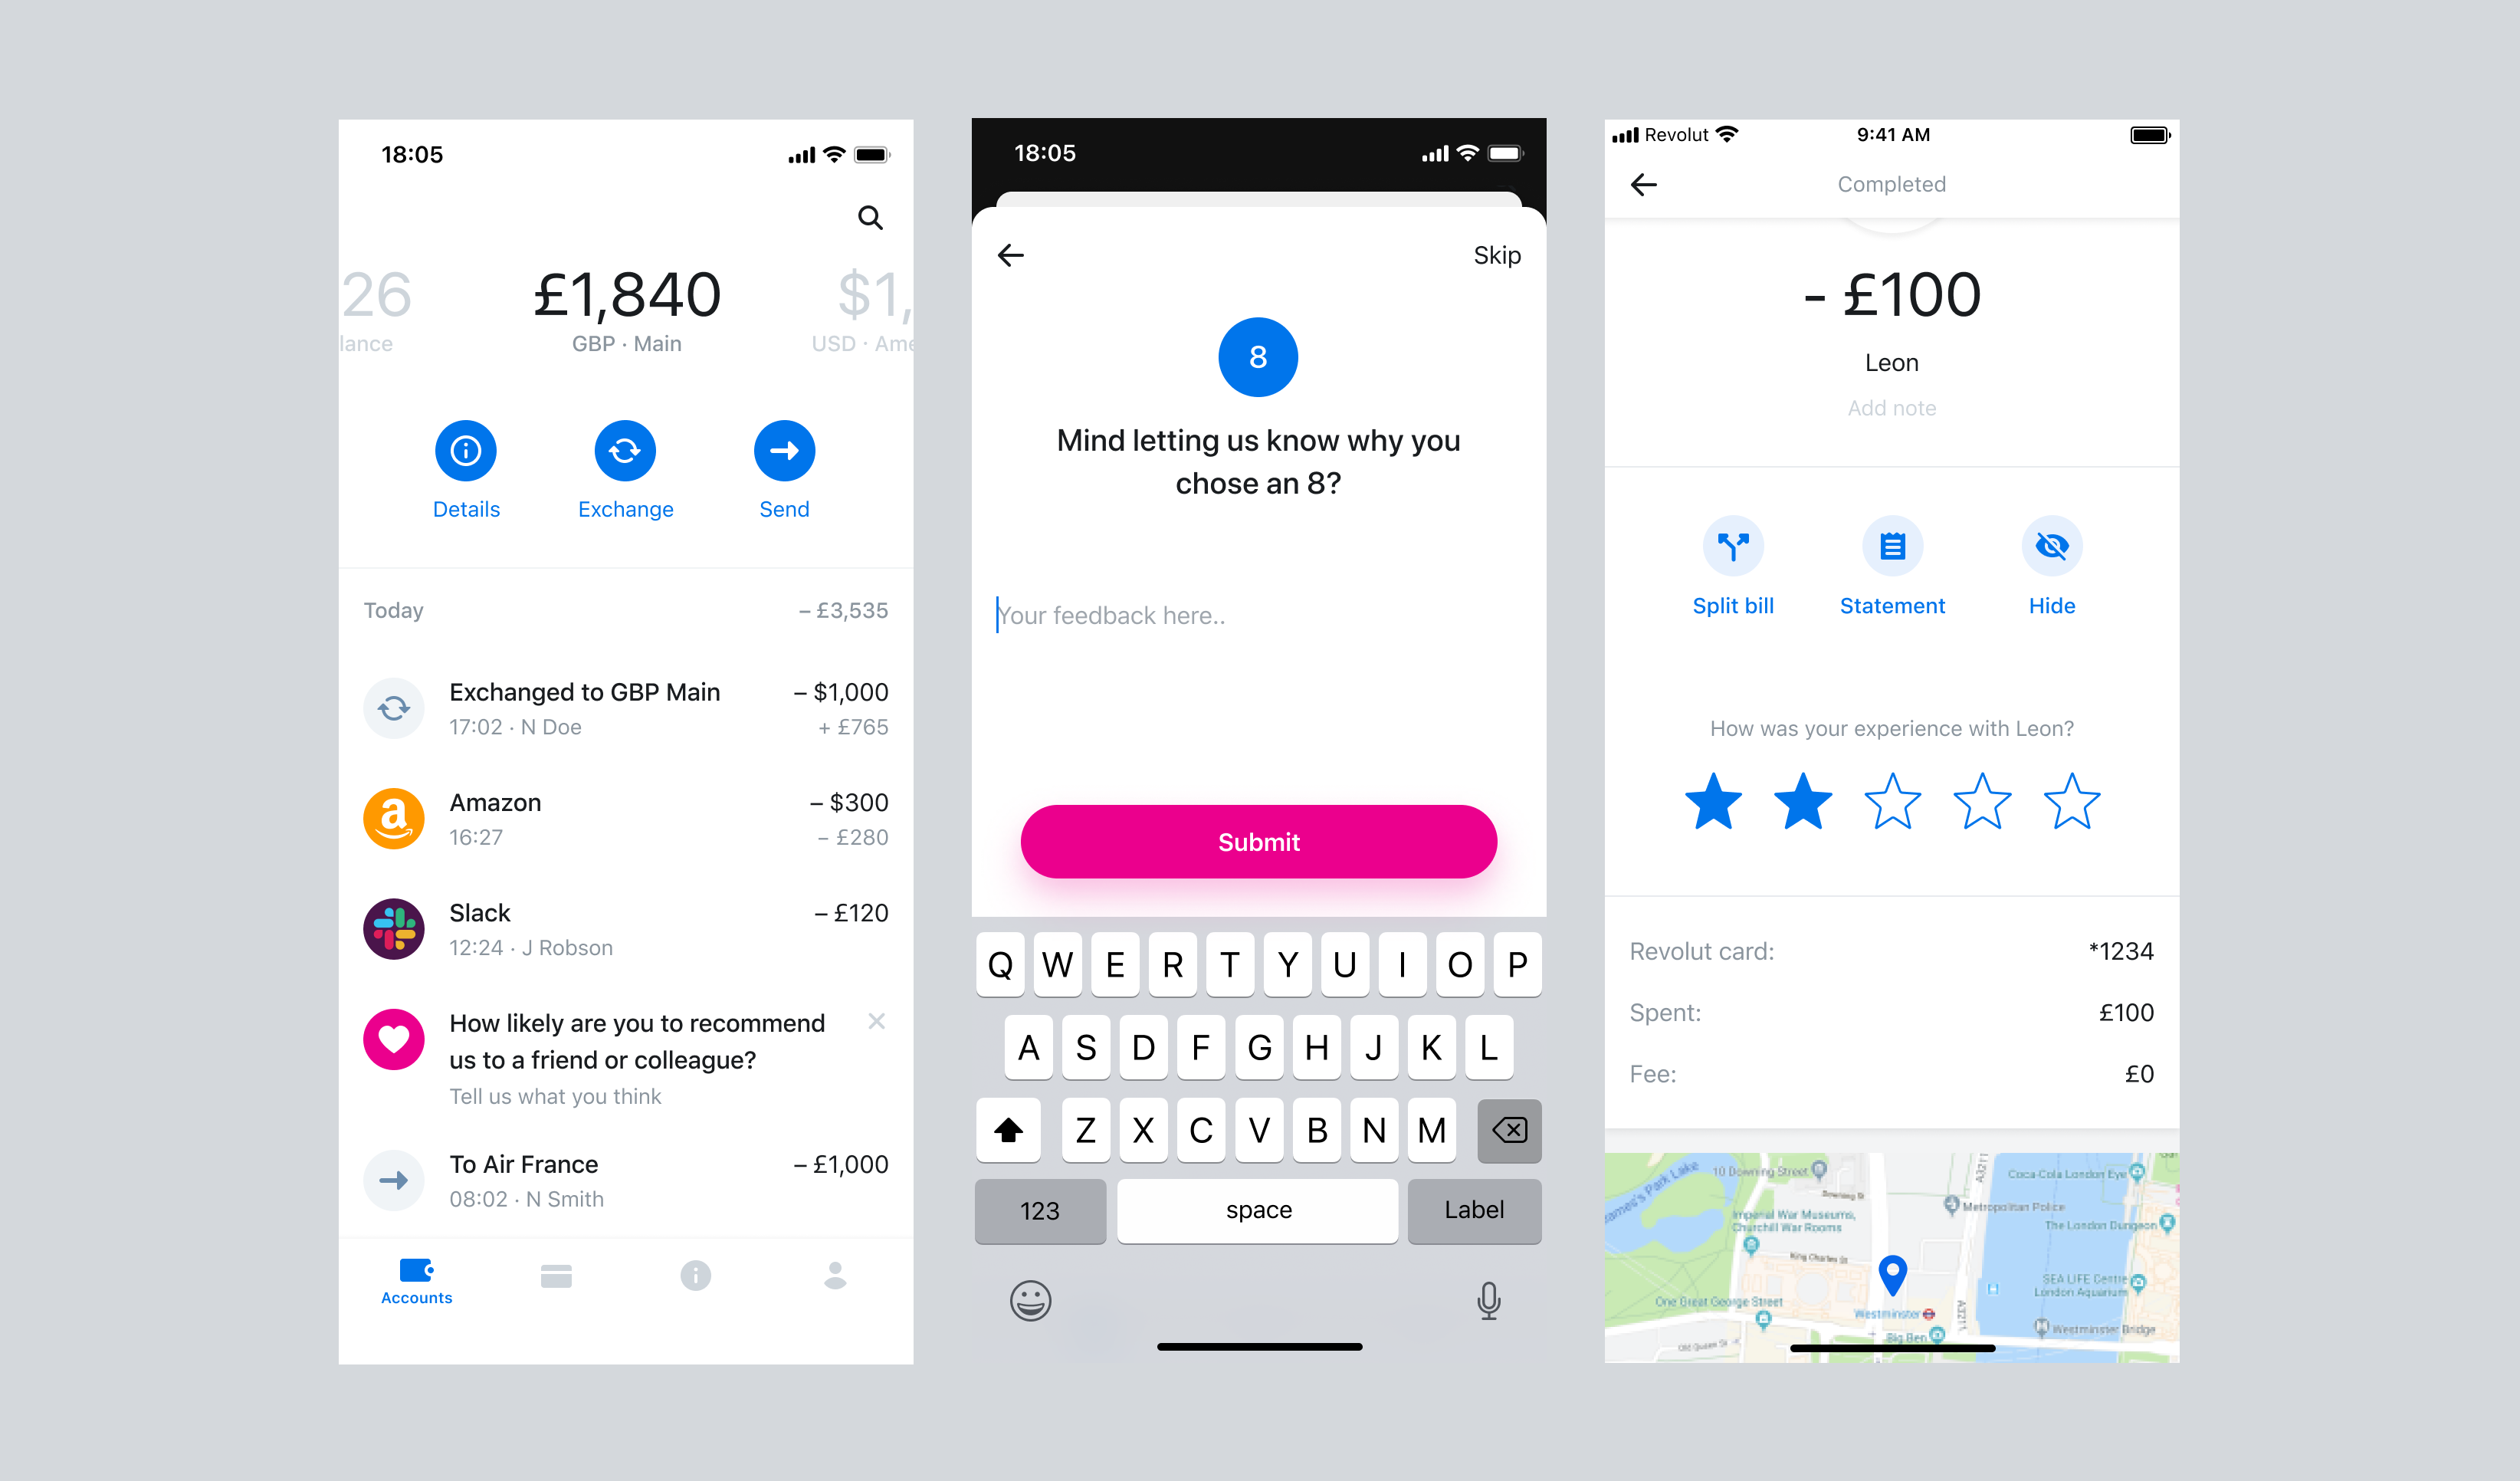
The first project was to build a survey that will be shown on the Accounts page post log-in as an in-app banner. Active users will be served with the 0 - 10 rating, so that they can rate the service. Once the survey is submitted and rating is provided, users are served with a thank you message. The thank you message will close automatically but the user will still have the option to close the banner via the available close icon.
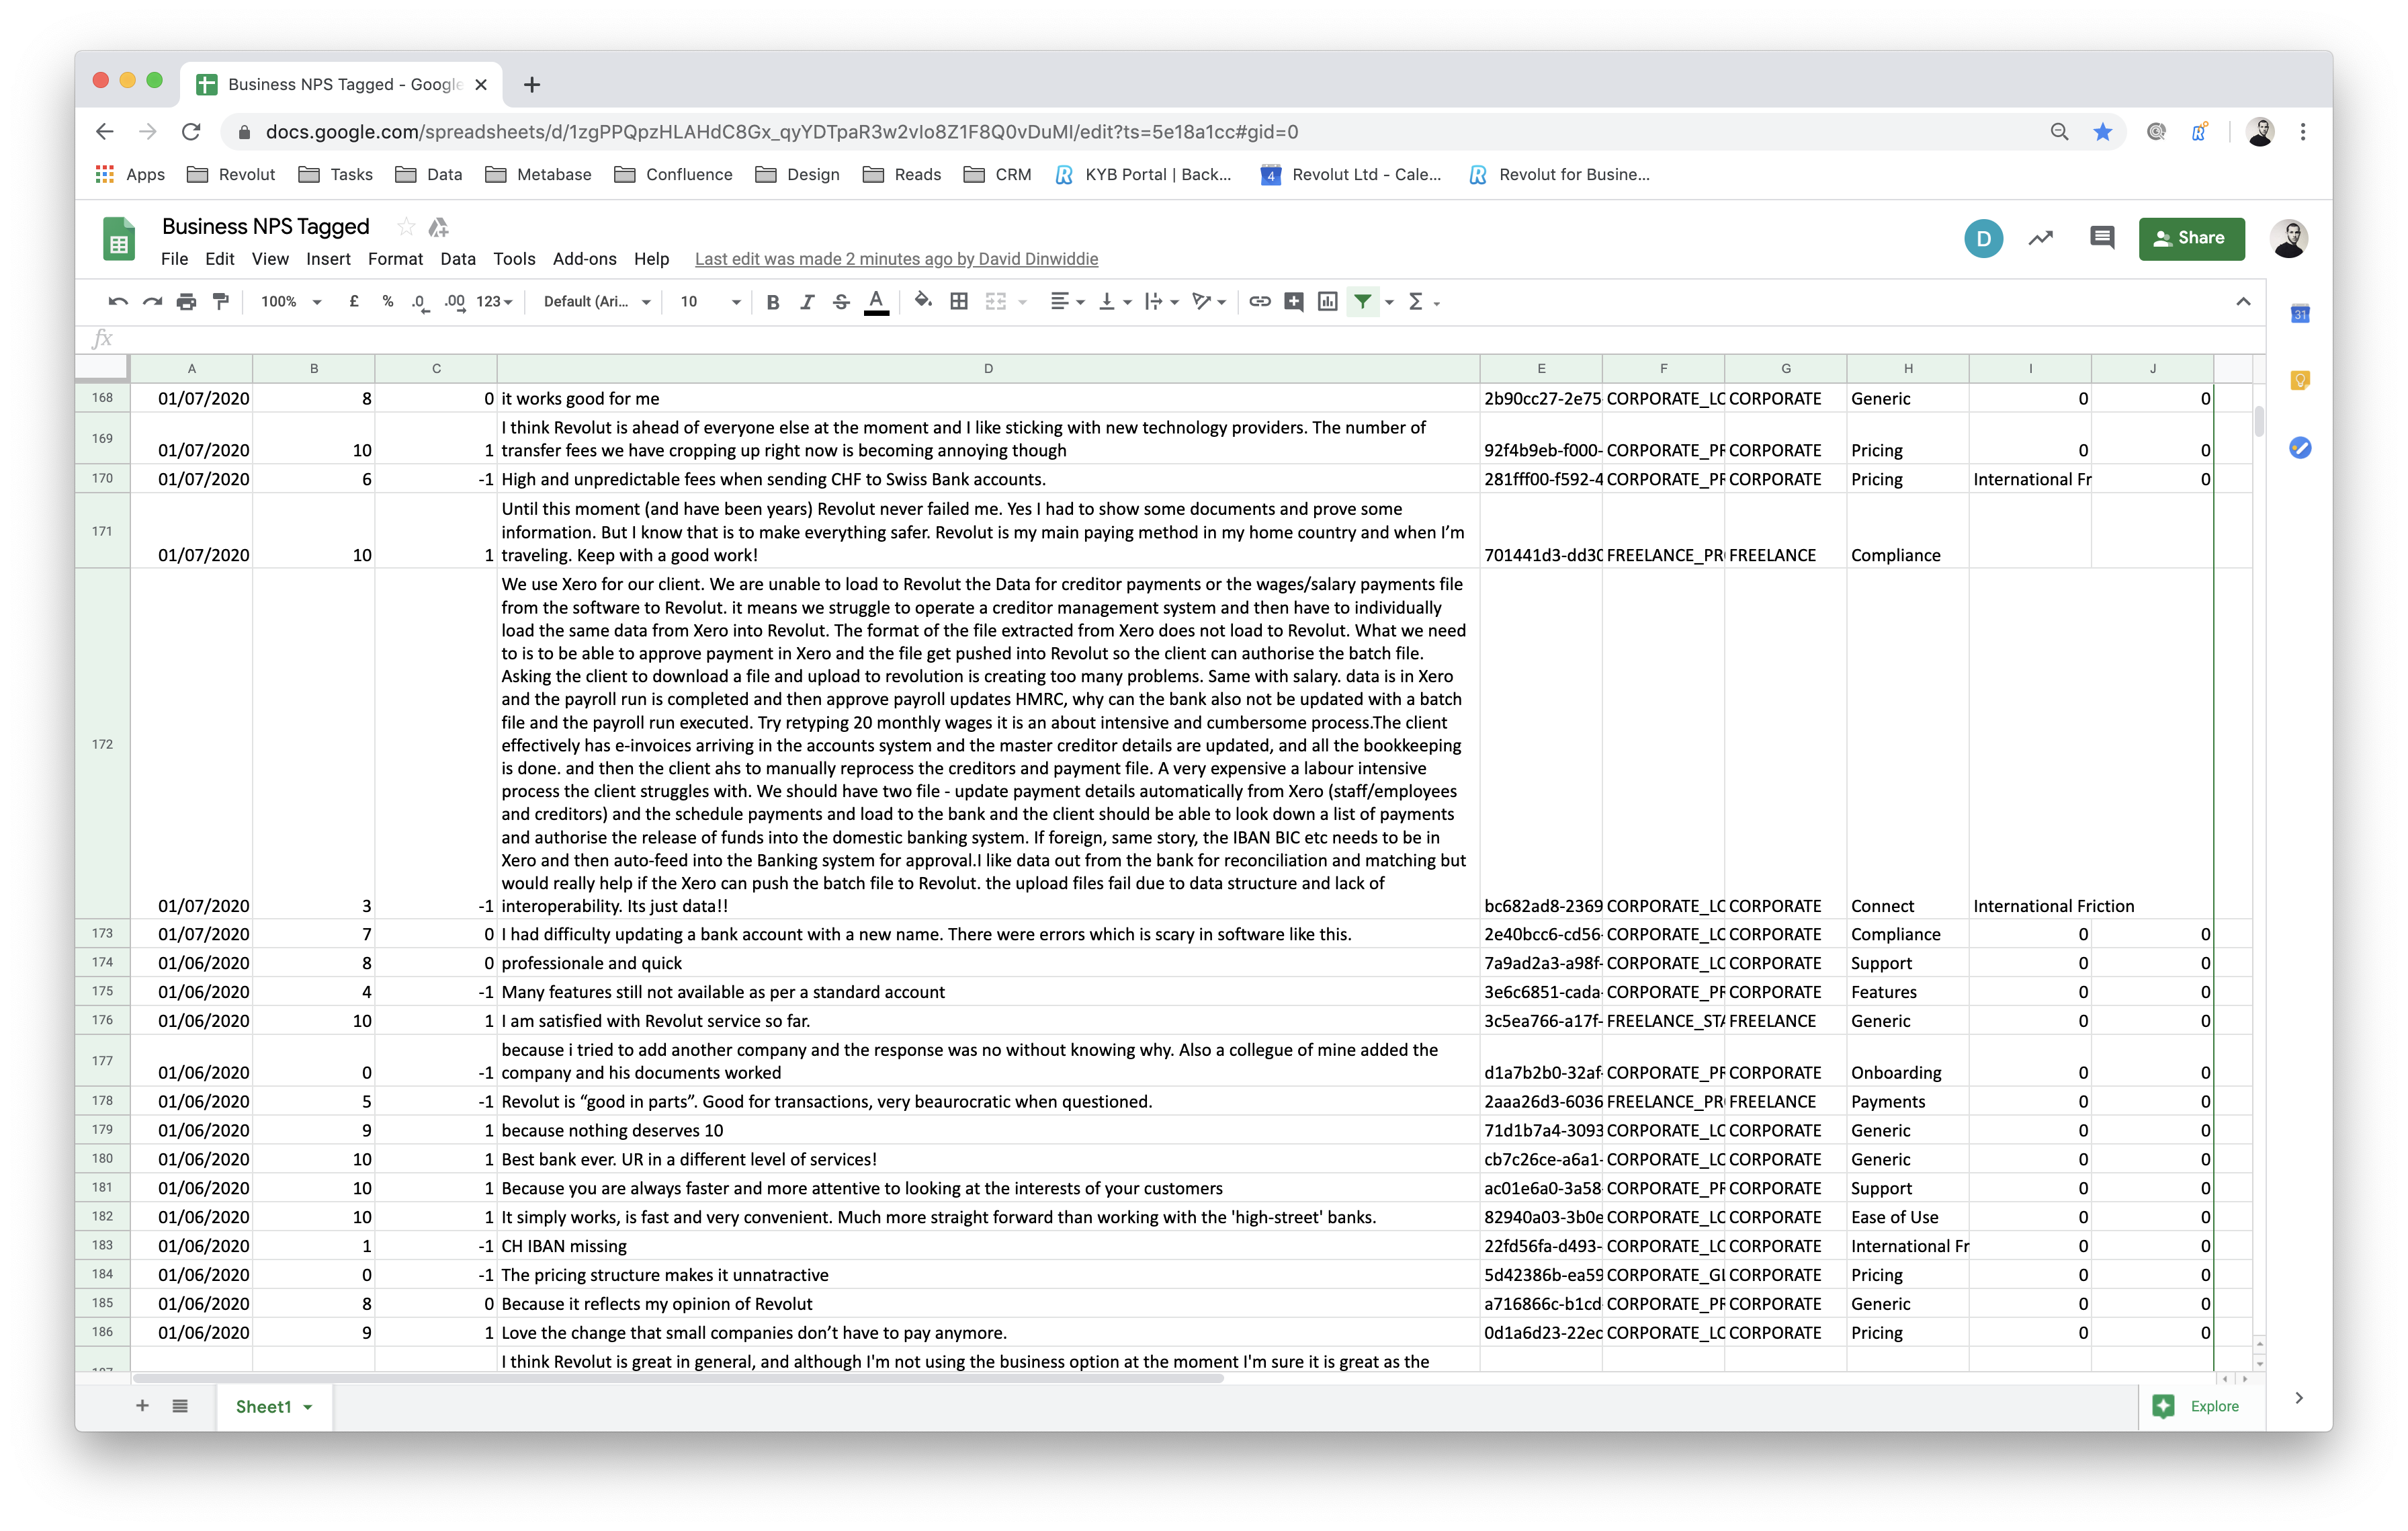
I started off by looking at past data and feedback that we have gathered from the user.
I also wanted to confirm the best placement for the survey. I have checked with the data analysts and checked which section of the screen is interacted most when it comes to notifications and banners. Two areas were suggested. These are the main banner on top of the screen, and the notification area at the bottom left.
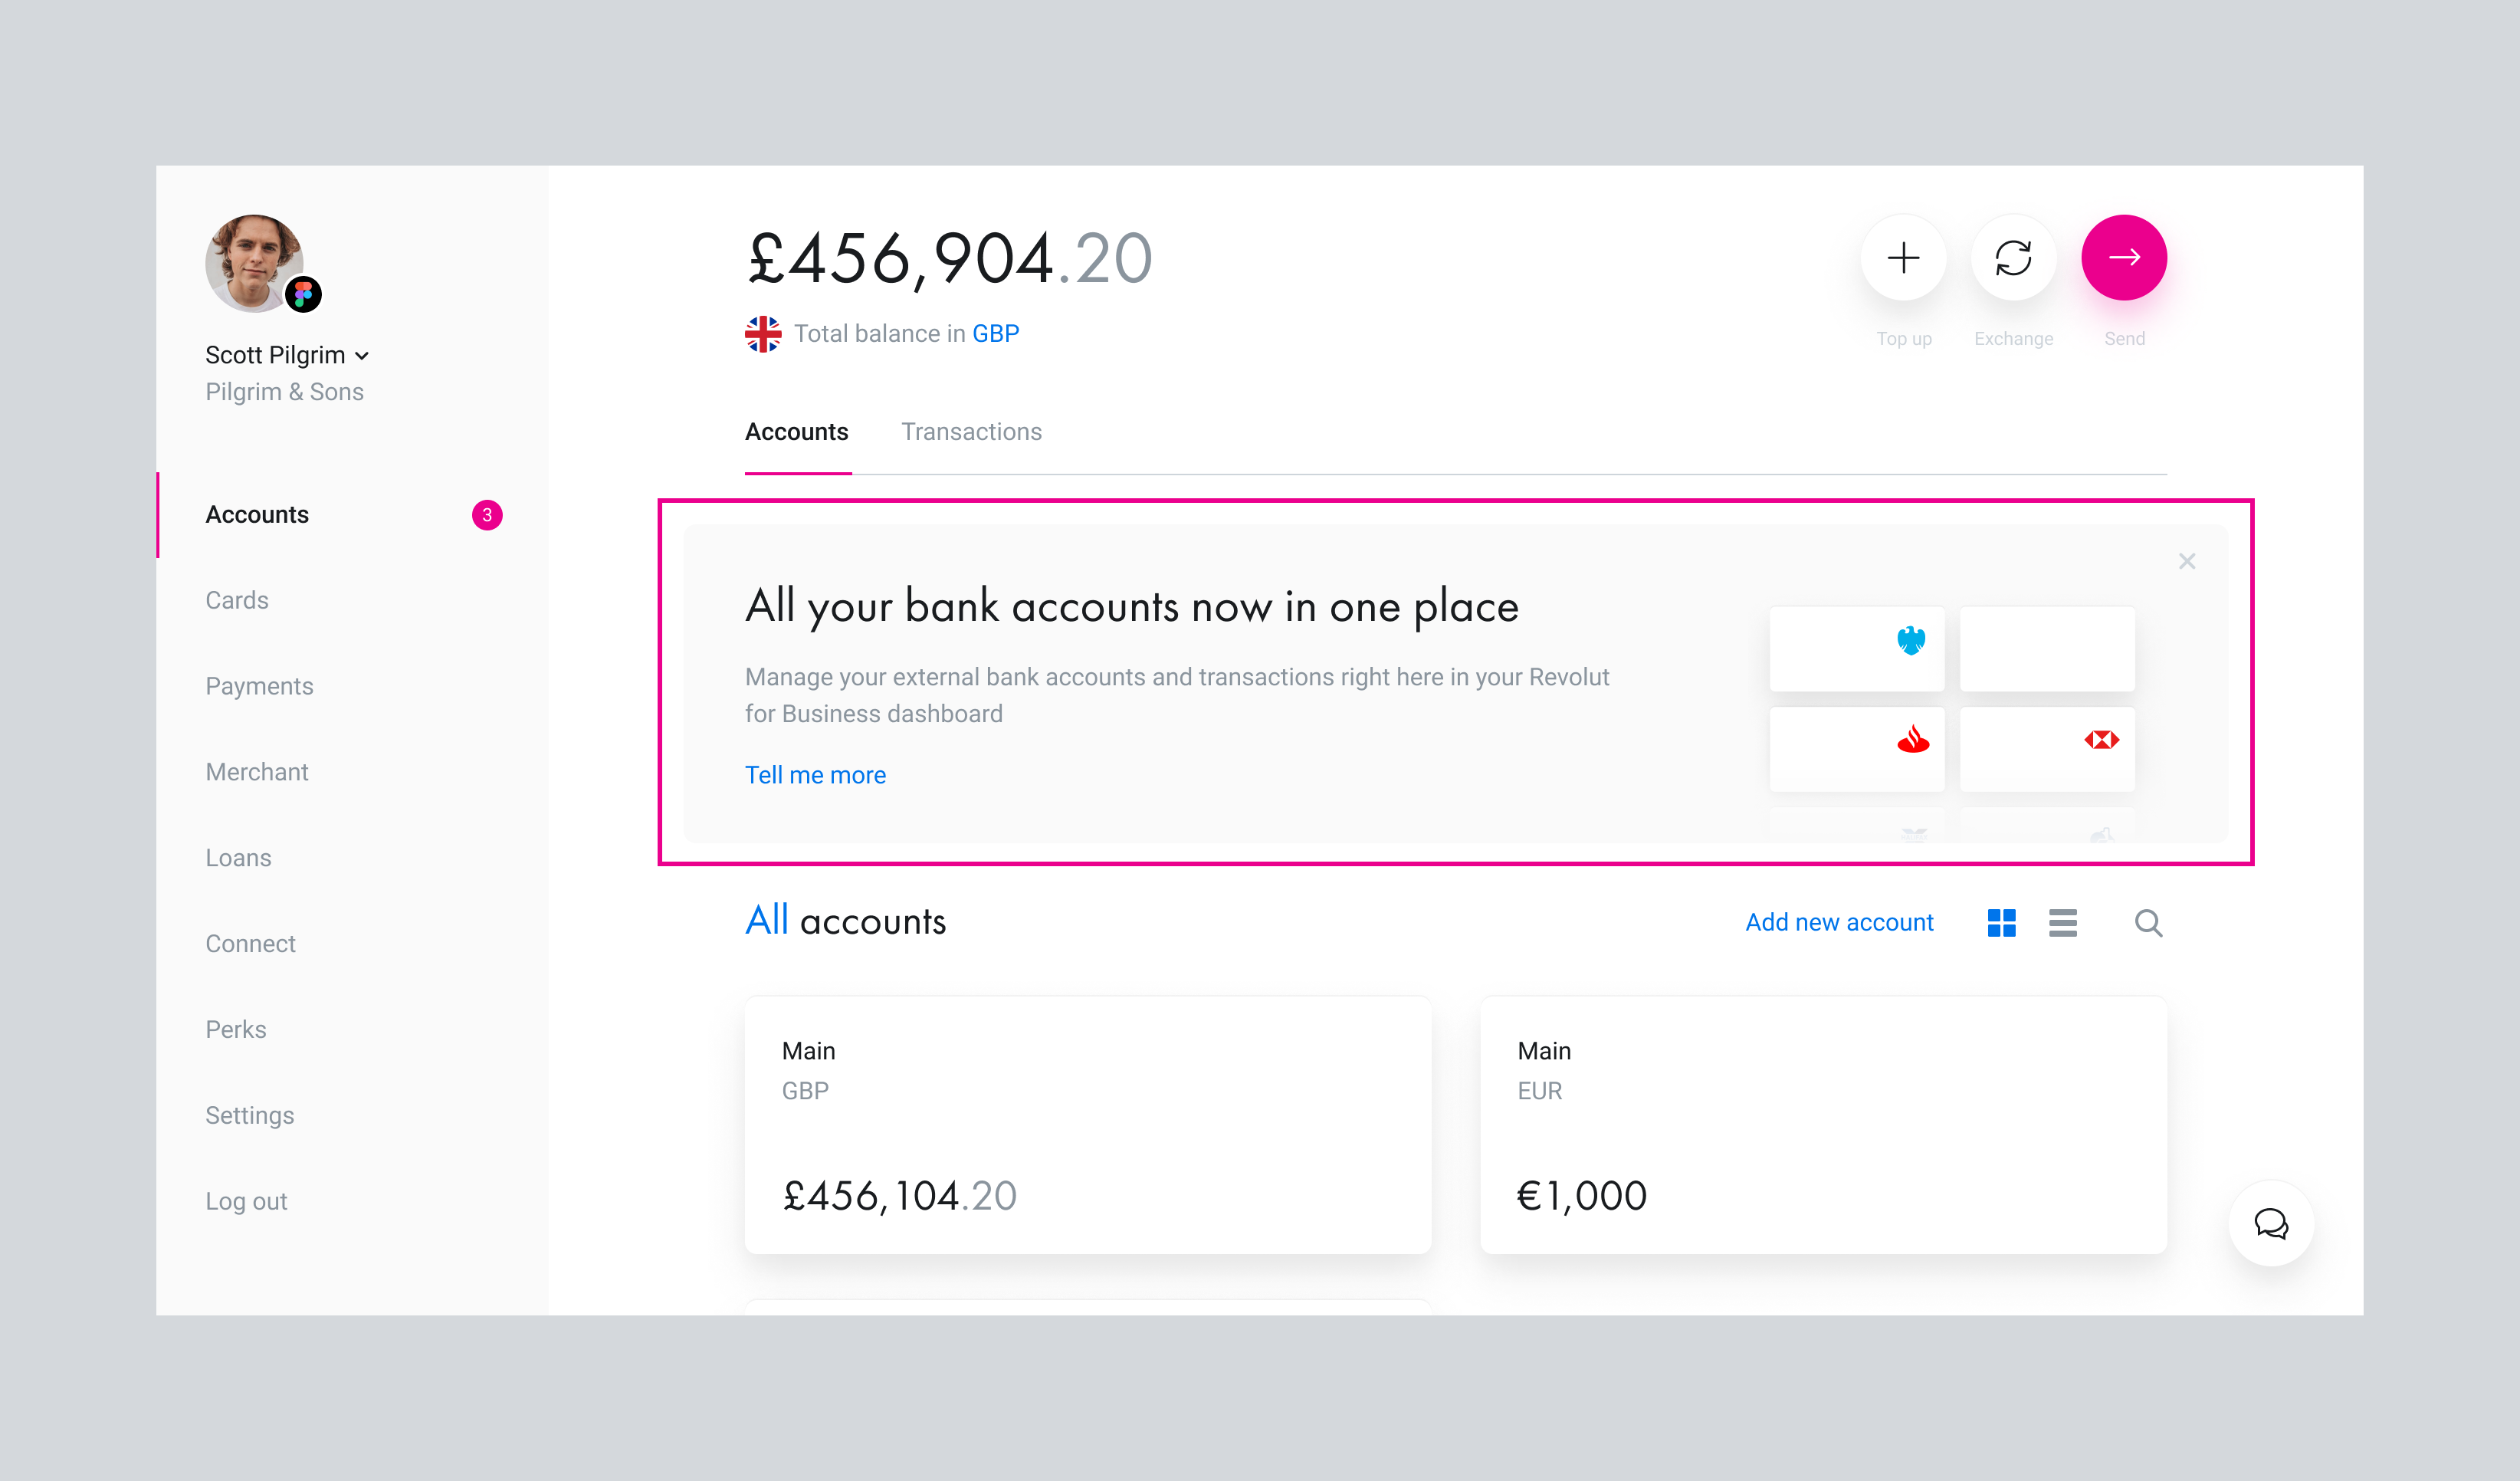

This led me to explore how the survey might look like in the banner, presented as a call to action.

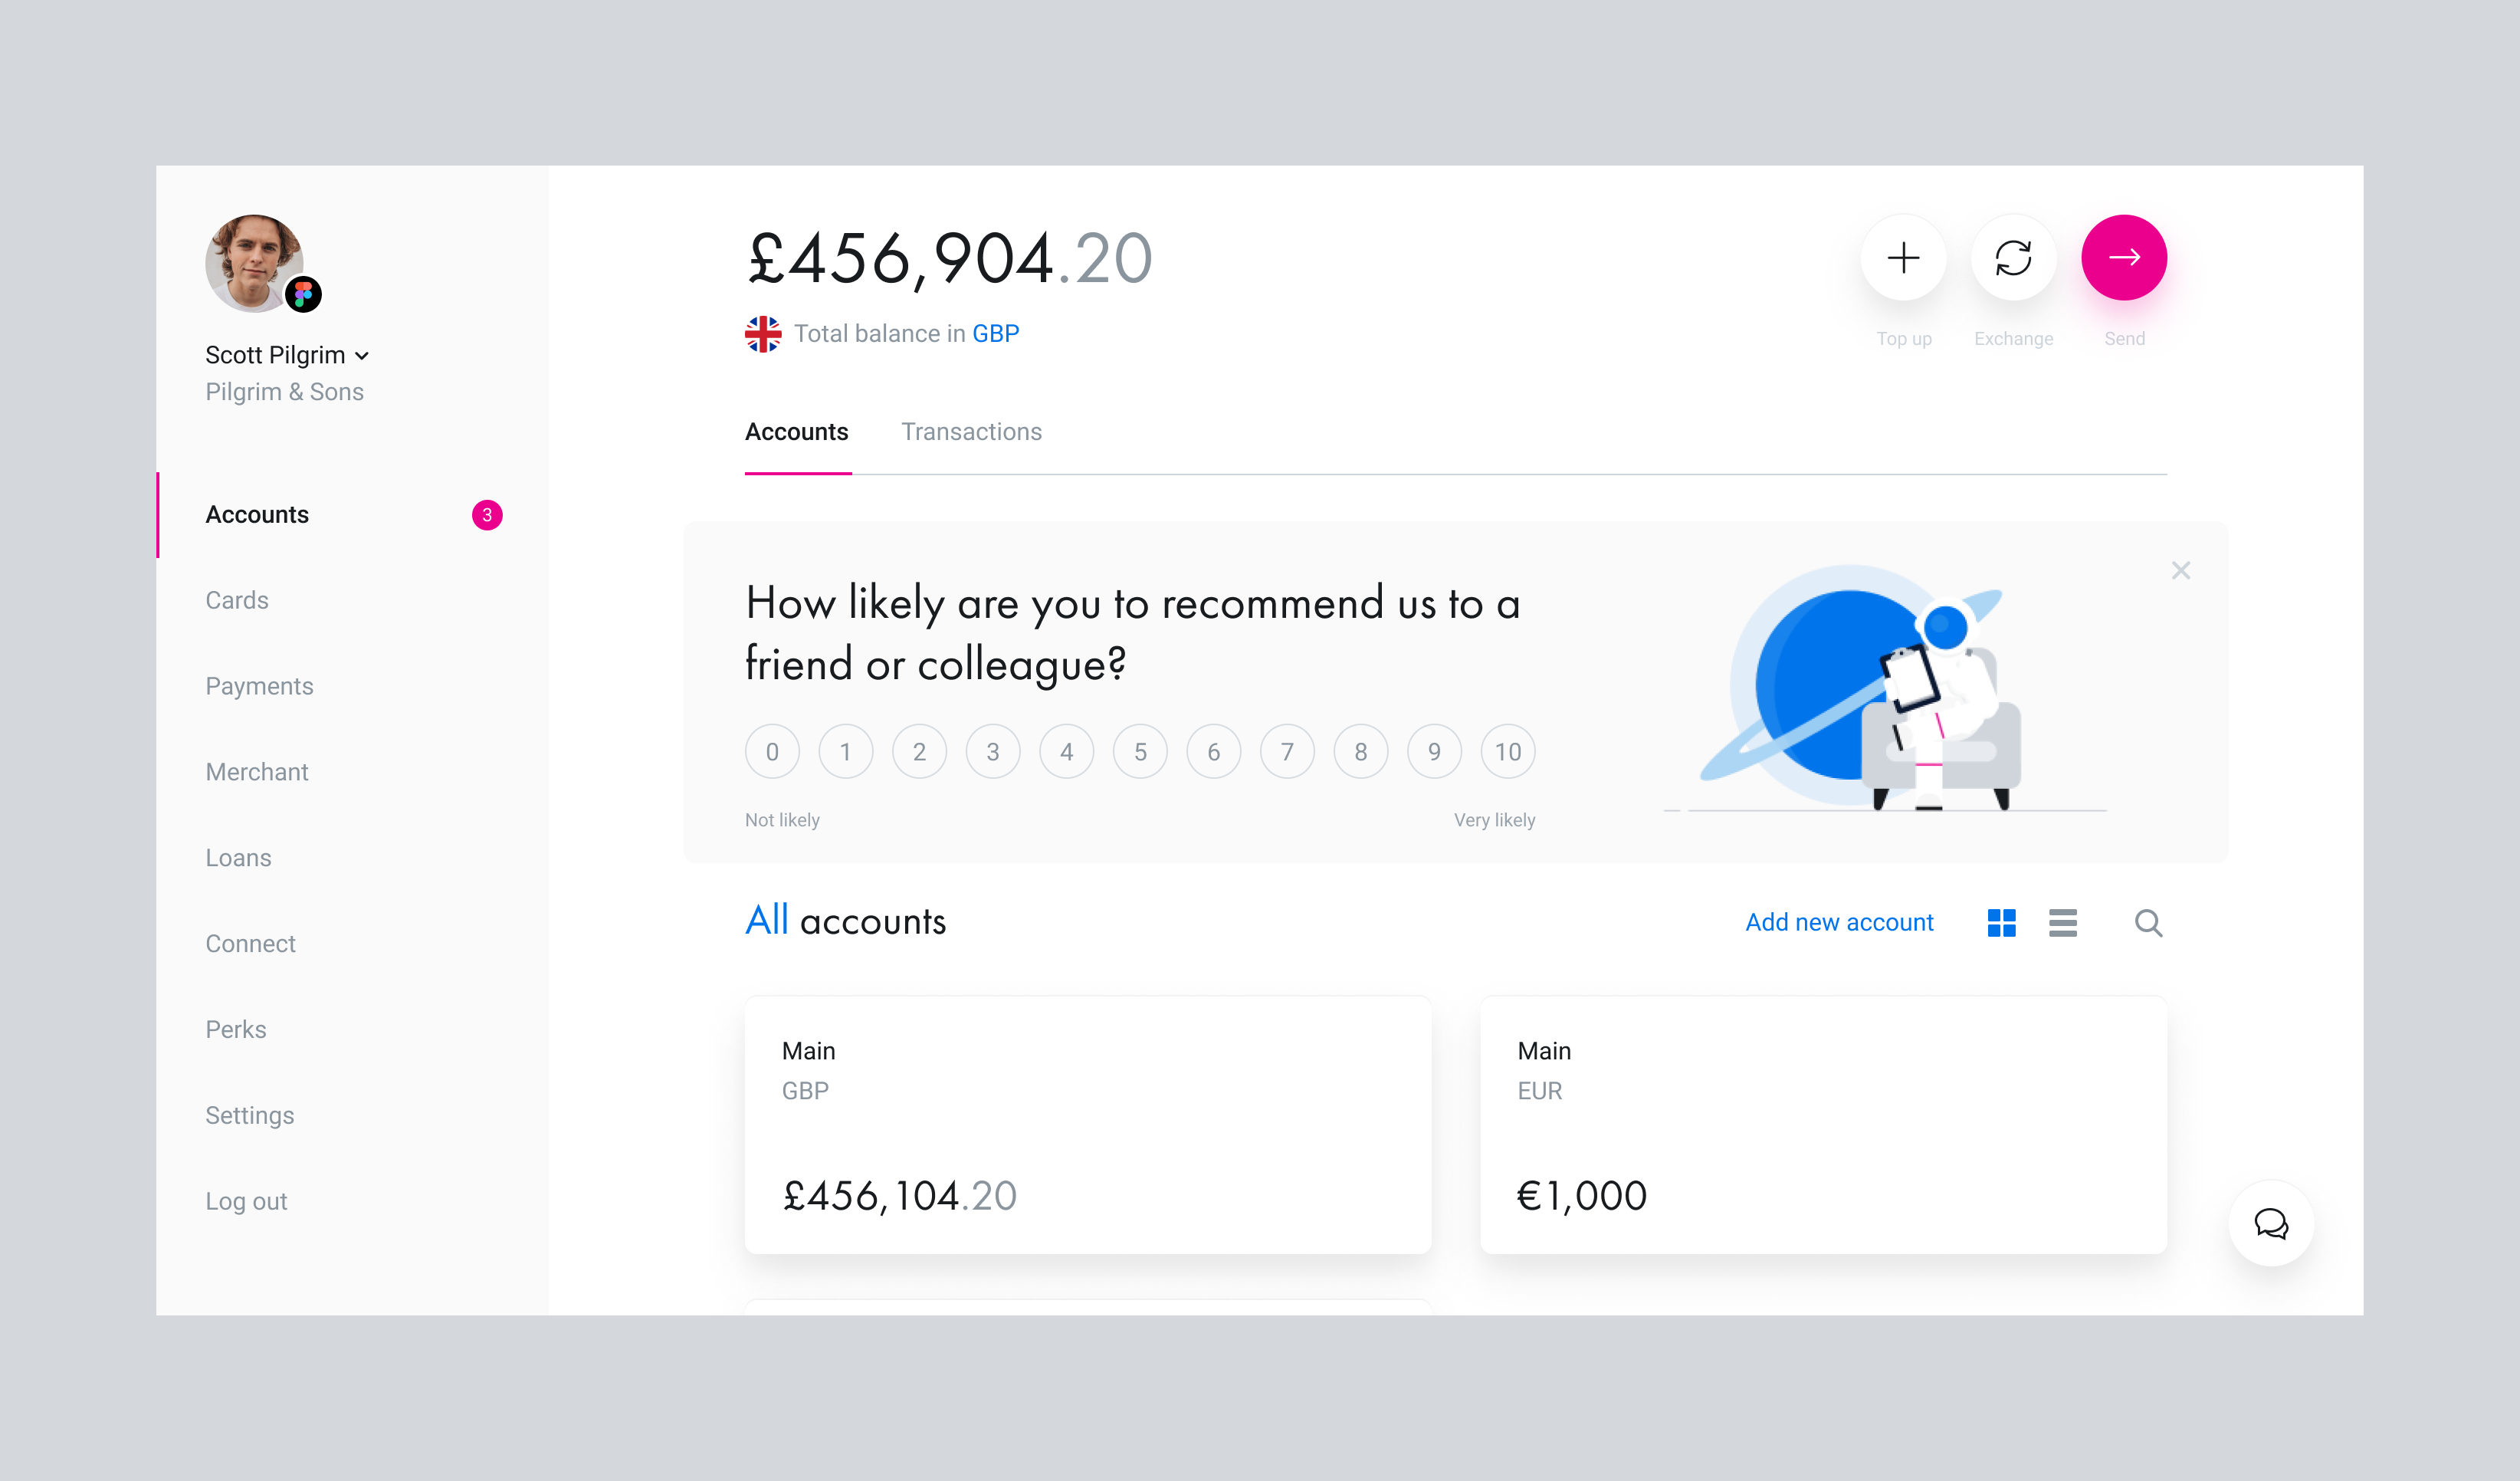
The final banner which was used as the first test
Since the idea was to actually work on a survey builder that eventually will be used by all the business teams in the company, I wanted to make sure to test both versions. We tested both the banner and the toast survey.
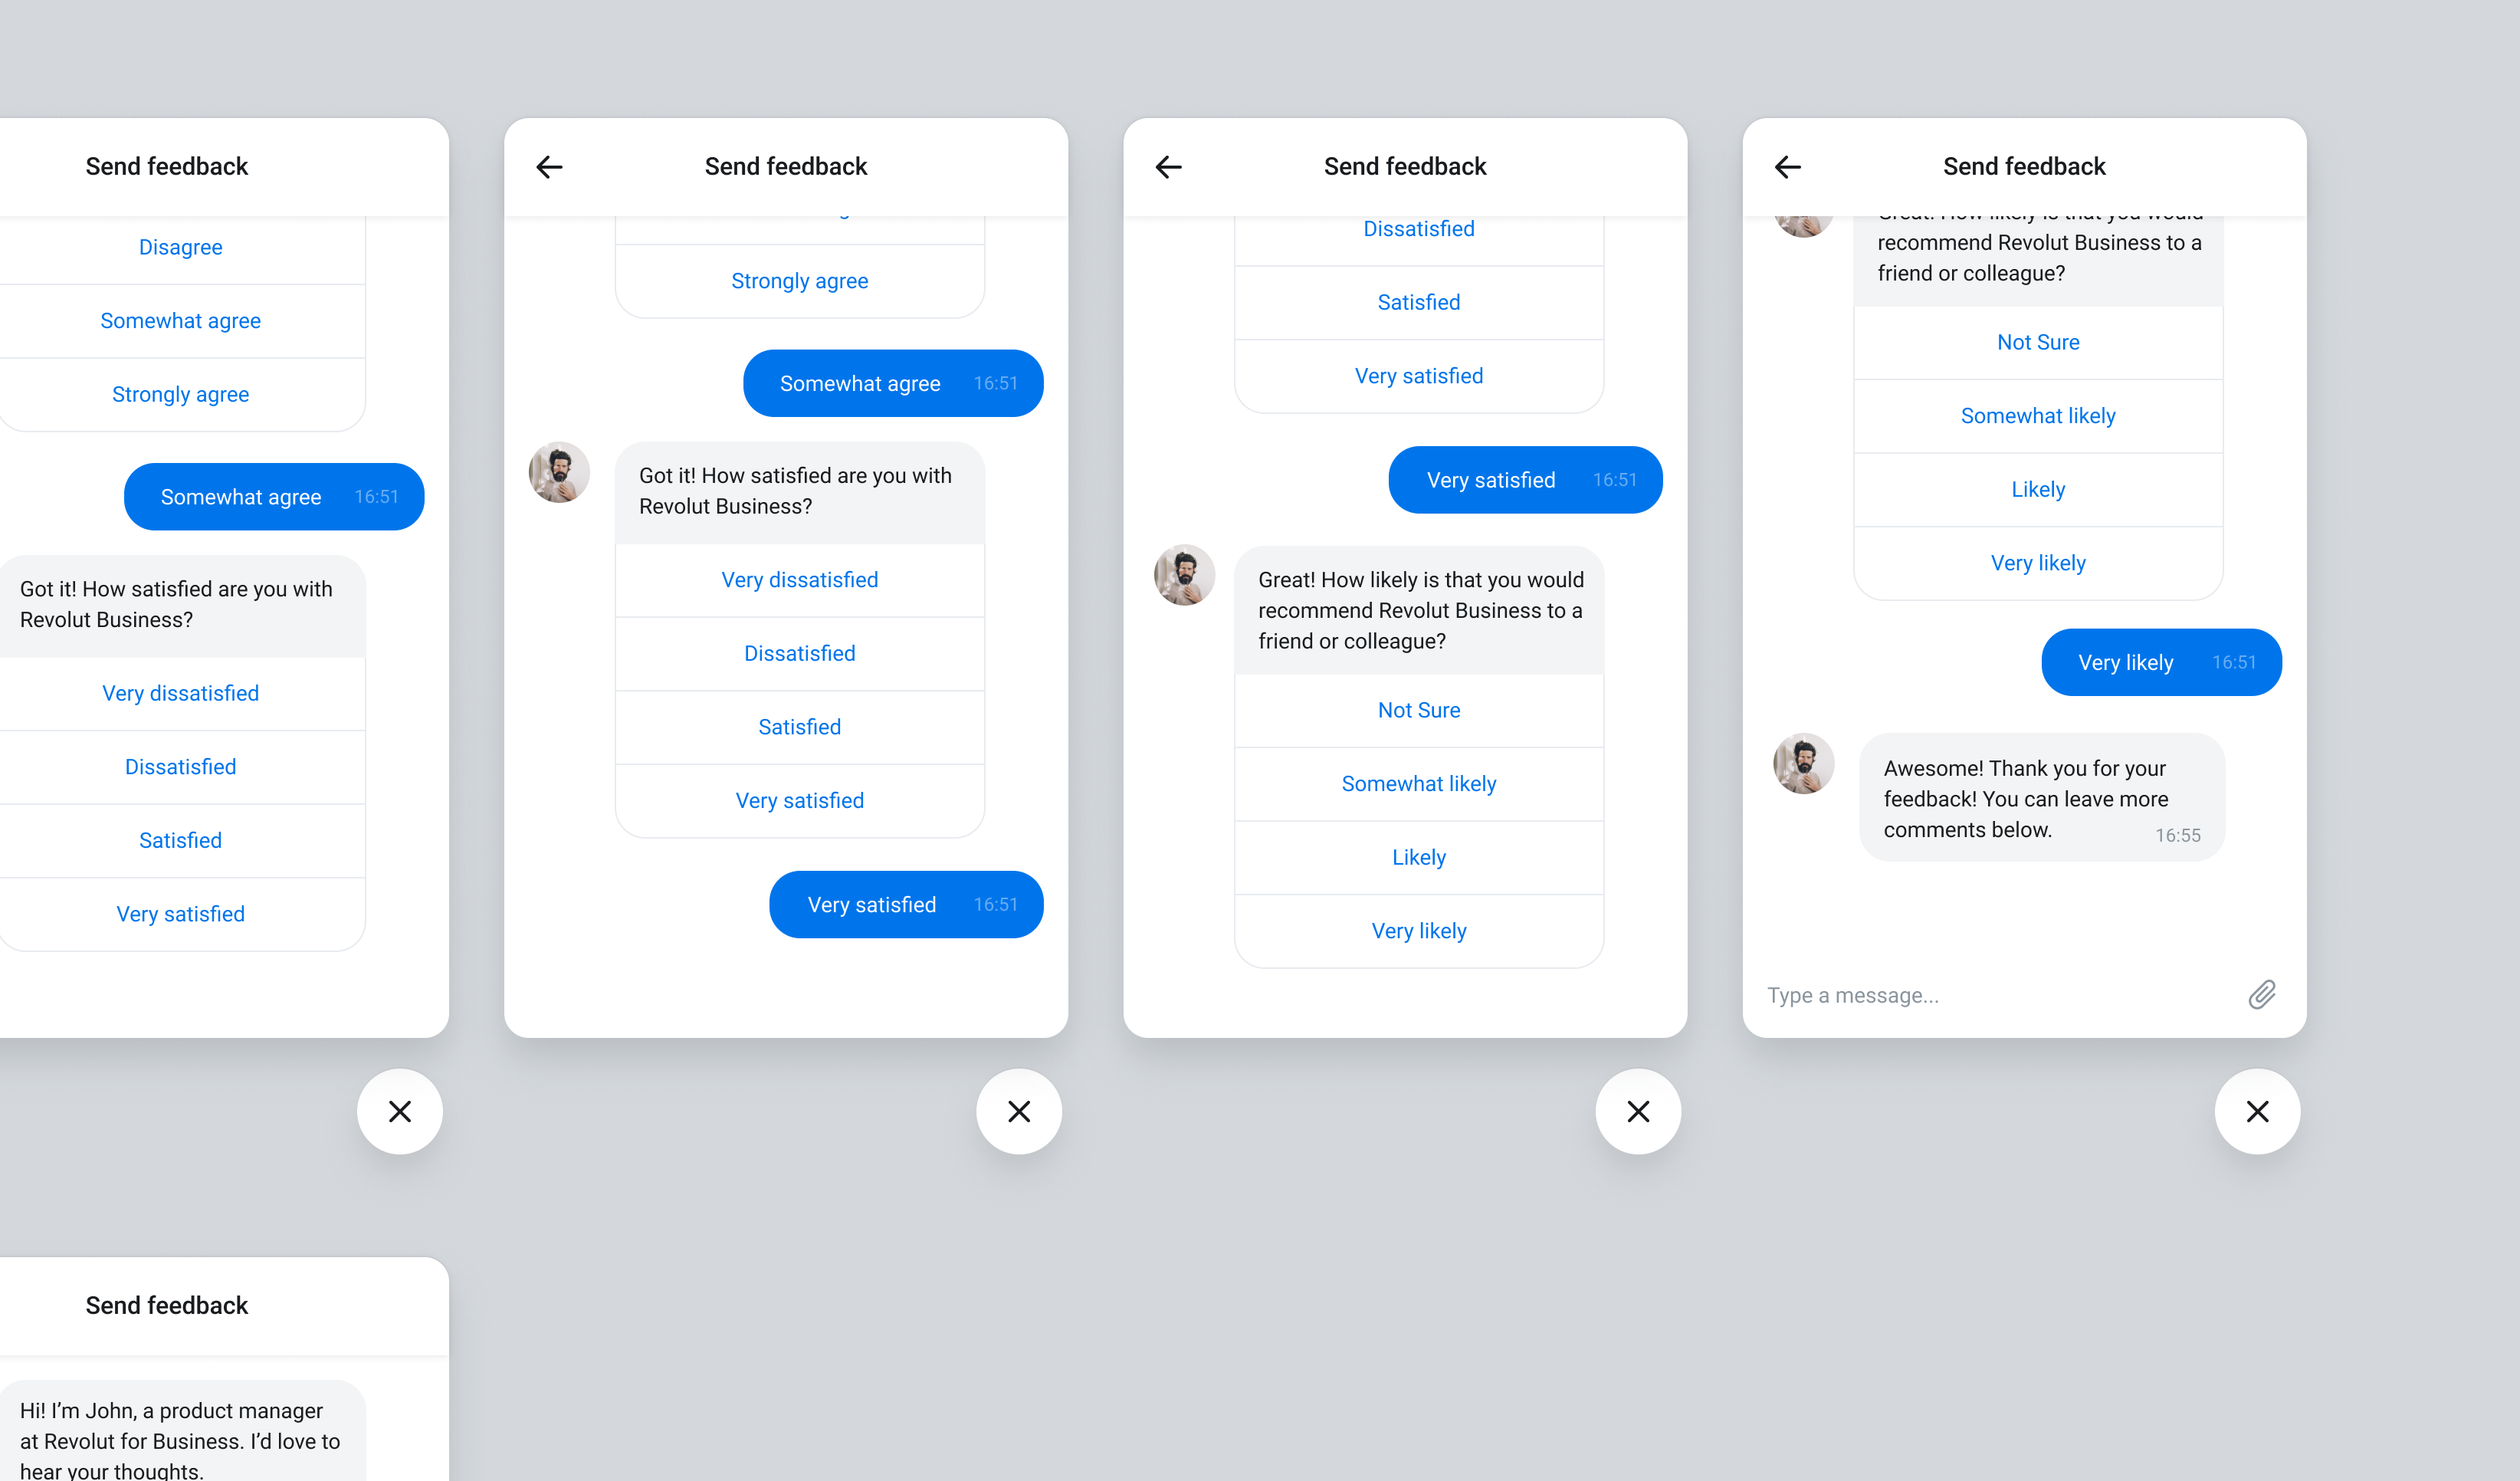
The below videos are some prototypes I did to illustrate how the toast would behave.
I also made sure that both surveys are responsive and accessible on mobile devices. I tested the survey on a mobile-web app and the native app of Revolut Business.
Results
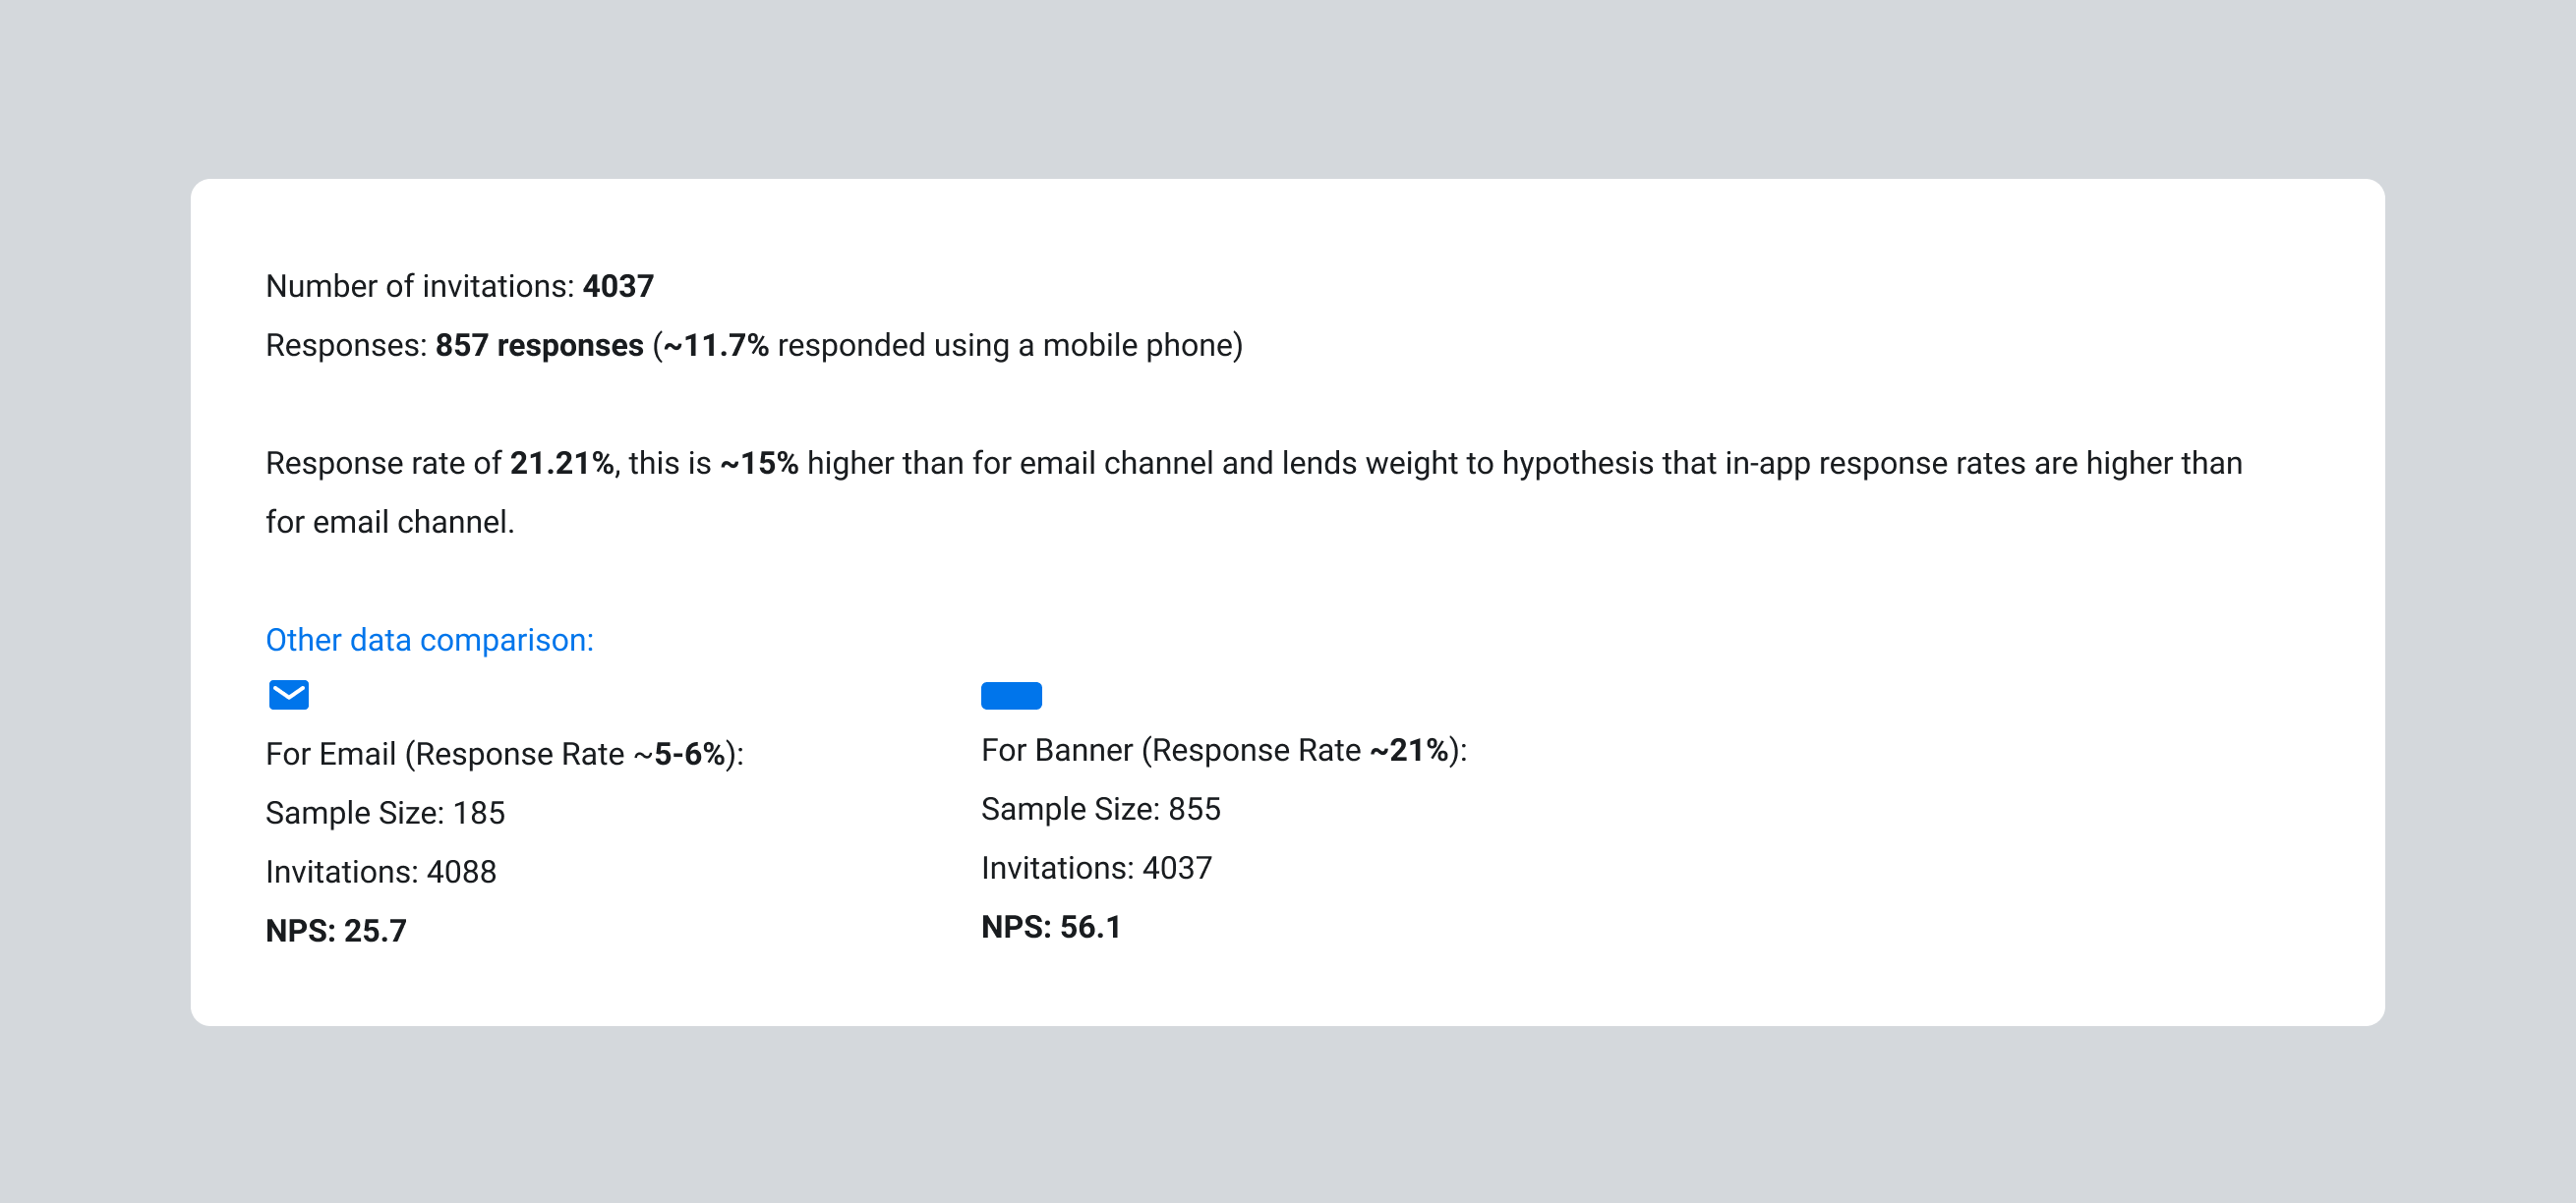
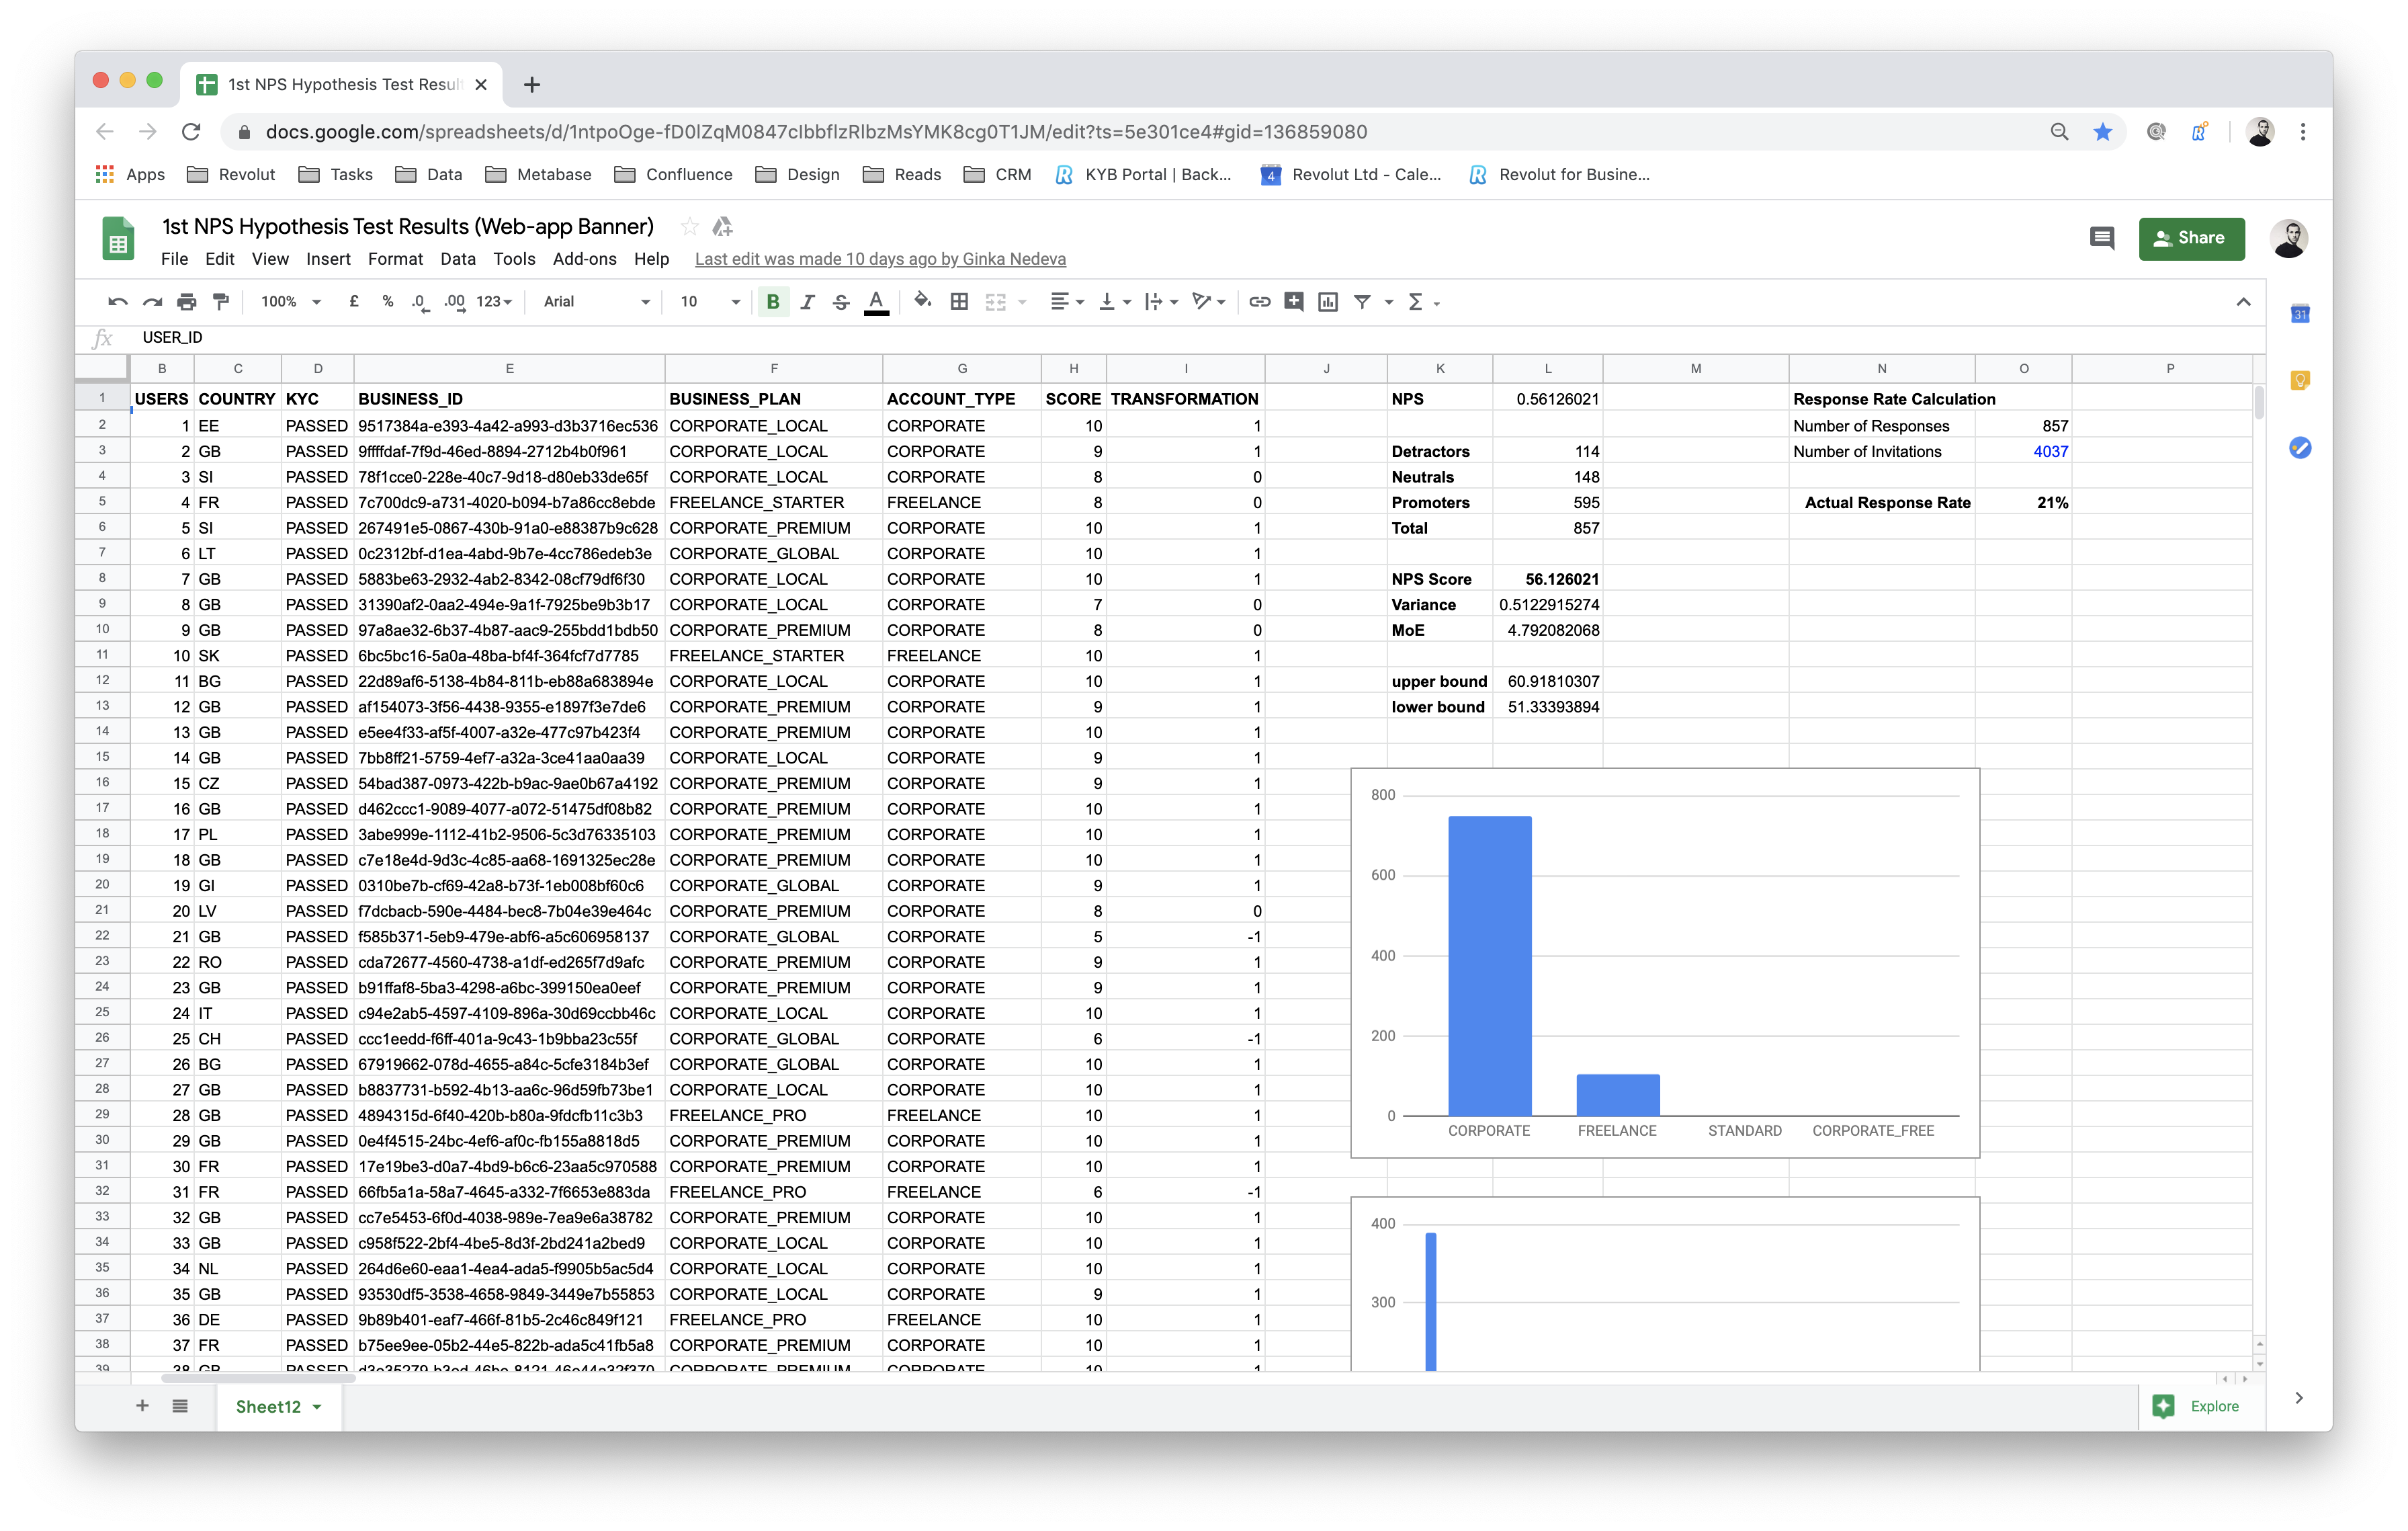
Both tests were successful. NPS score was increased from 25.7 to 56.1. It was also concluded that the response rate baseline of the web-app banner was ~20%, and the response rate for the web-app toast was ~35%. This helped us narrow down the options for the placement of the survey.
More Exploration
I started to explore other ways to distribute the survey to our users.
Exploring differnet entry points for the survey
I also explored the chat as an entry point for the survey, but since the plan wasn’t to integrate the survey in the chat, the idea was parked aside to focus on the Survey Builder.
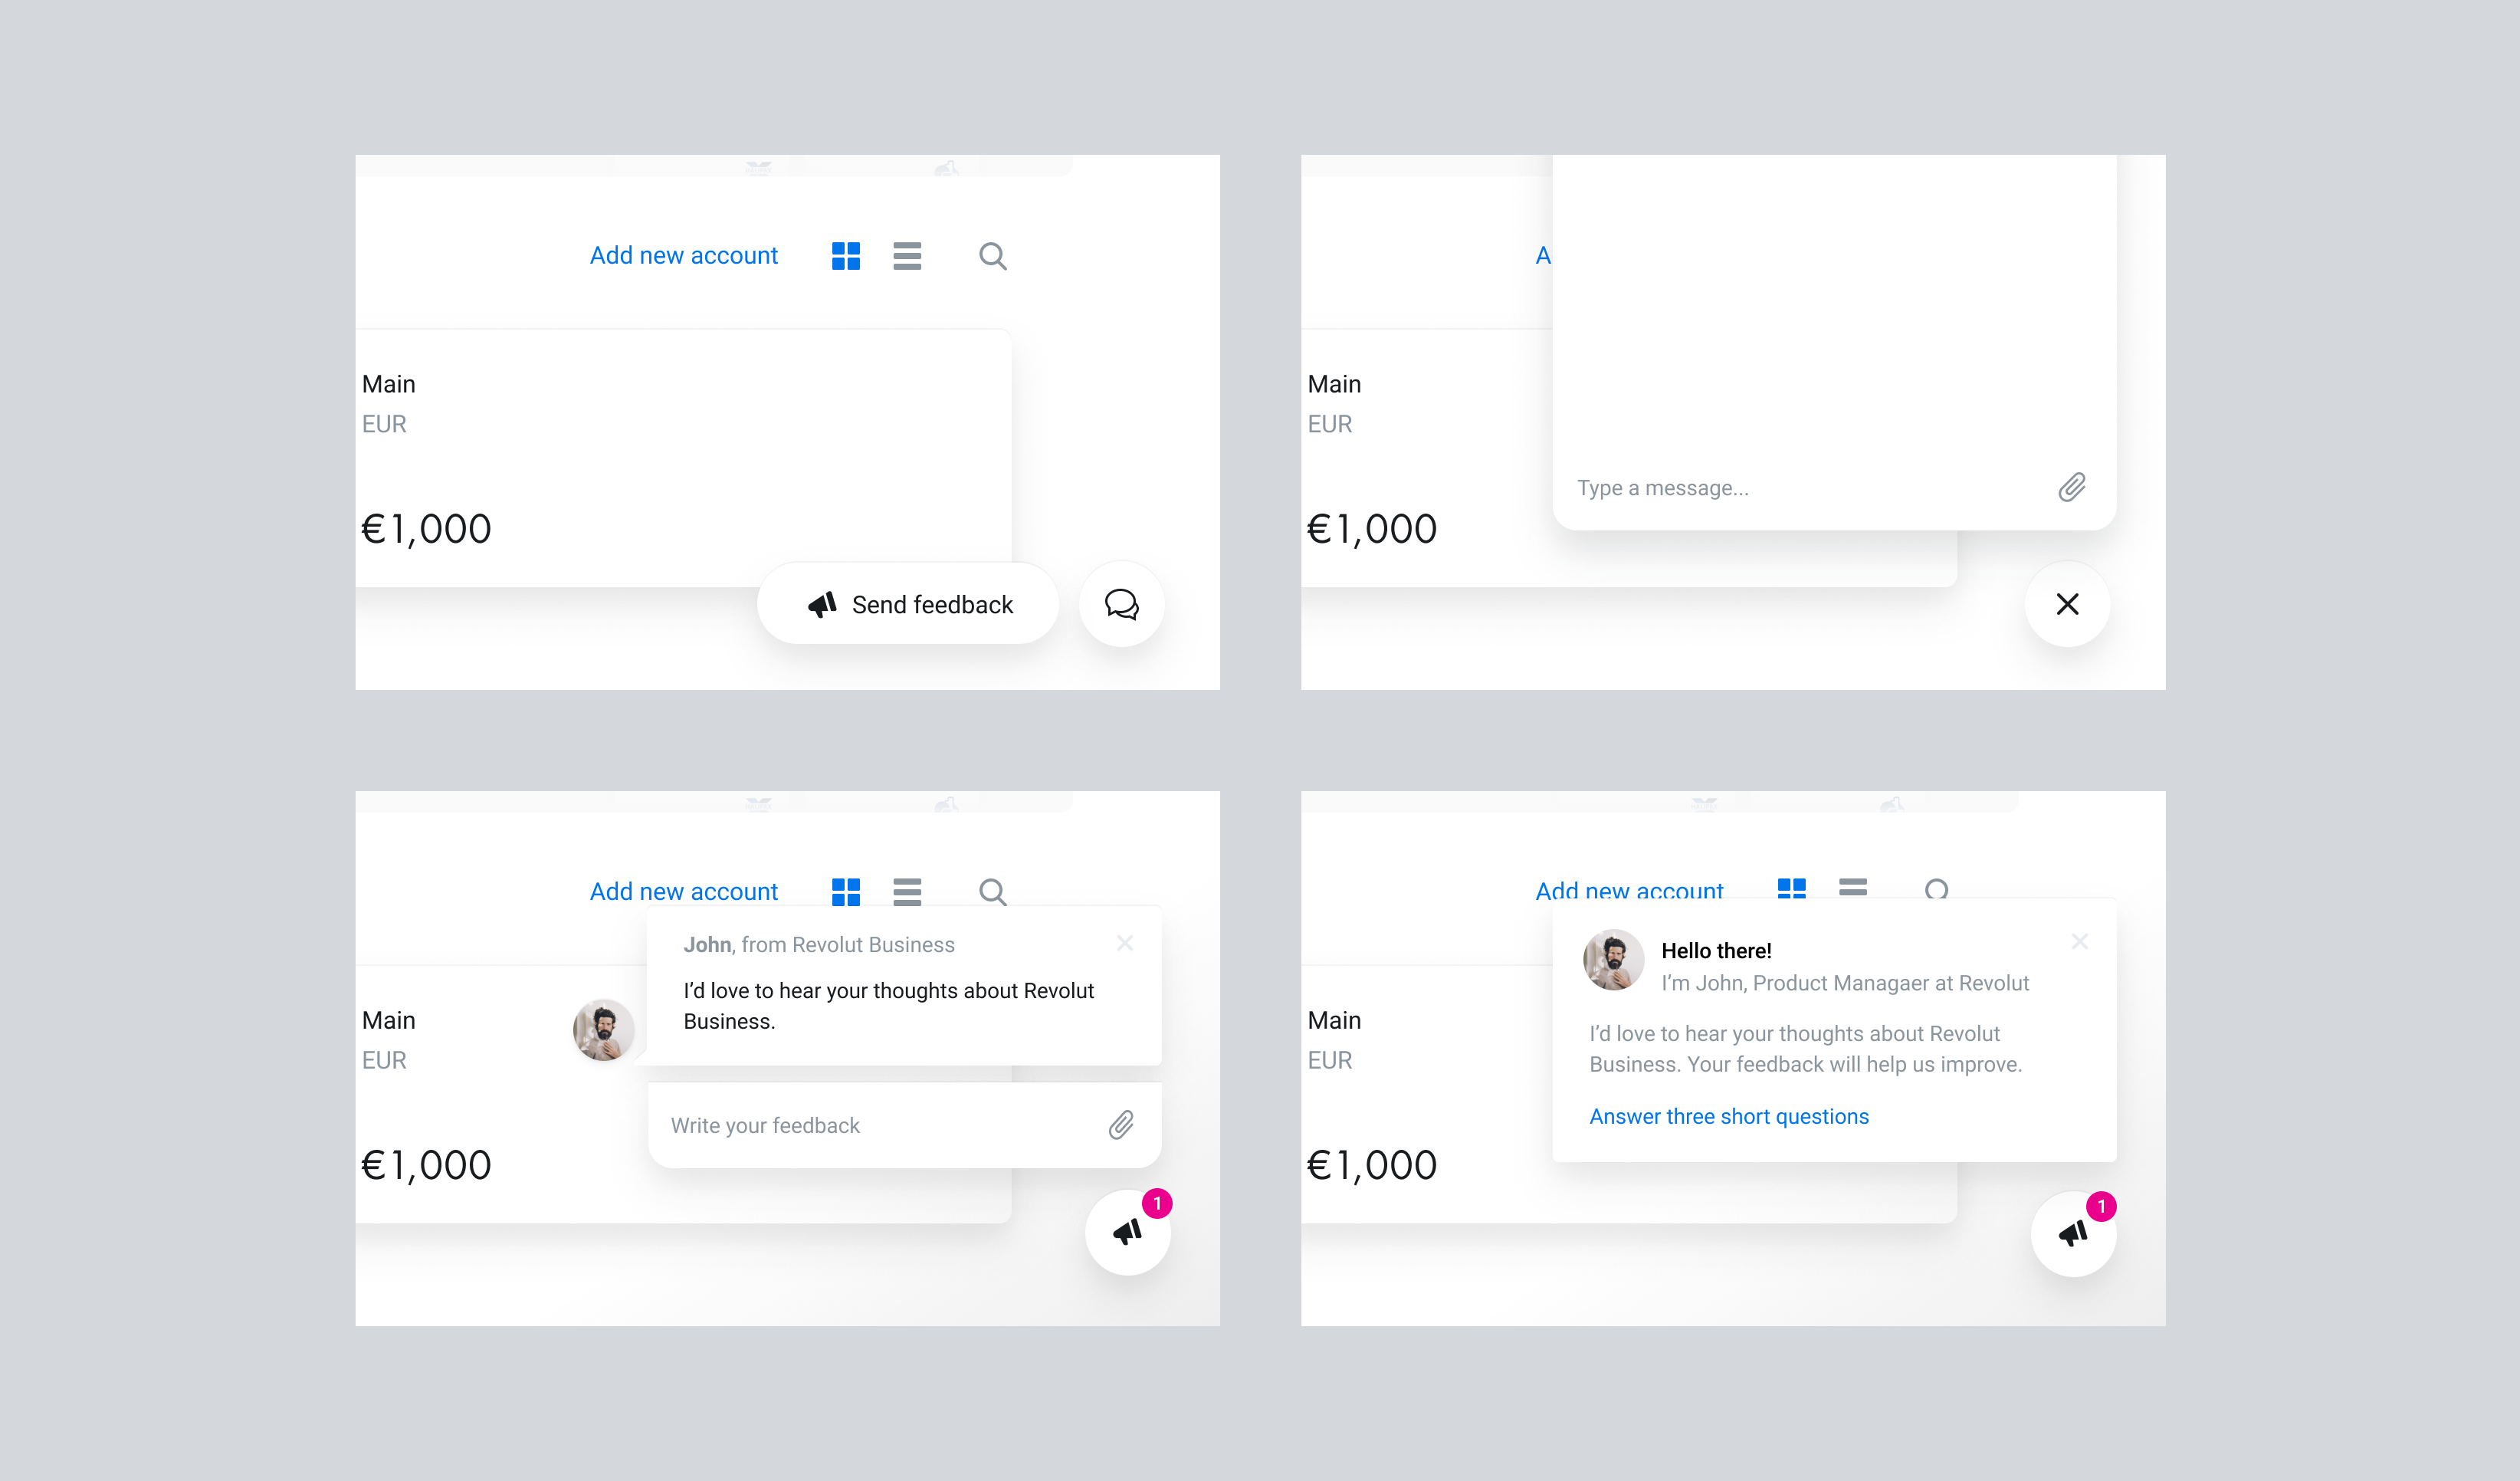
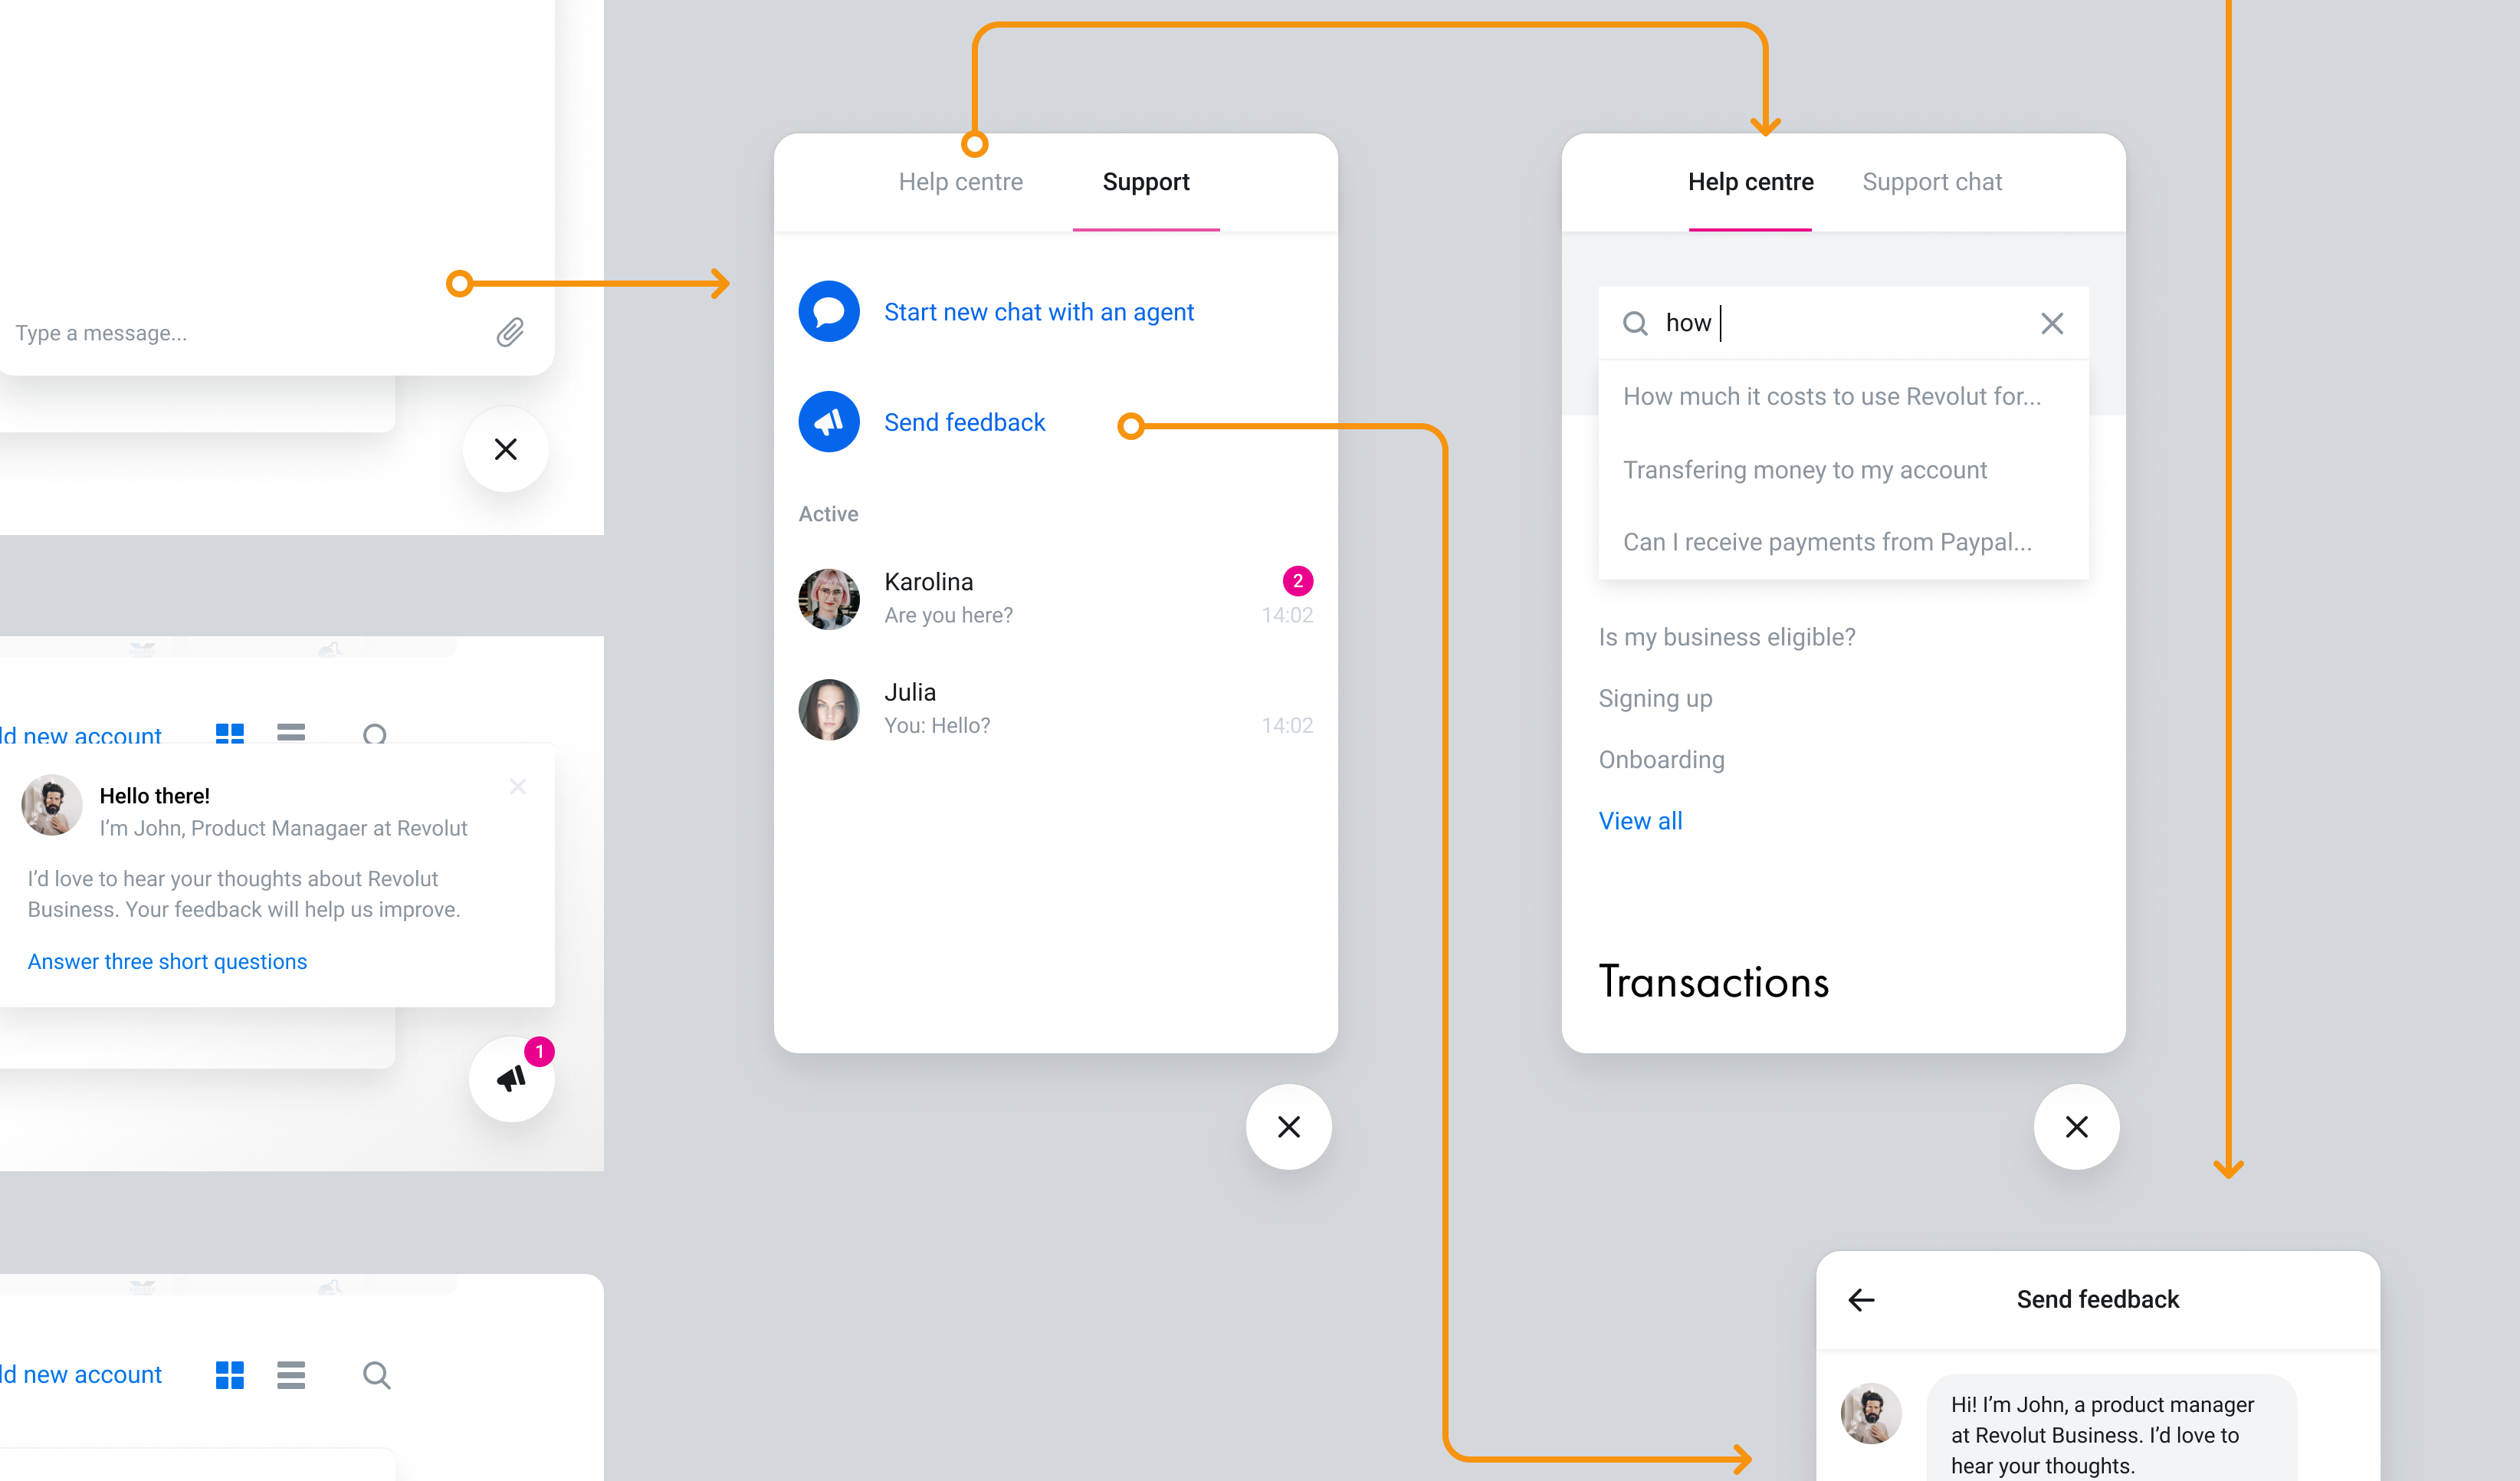
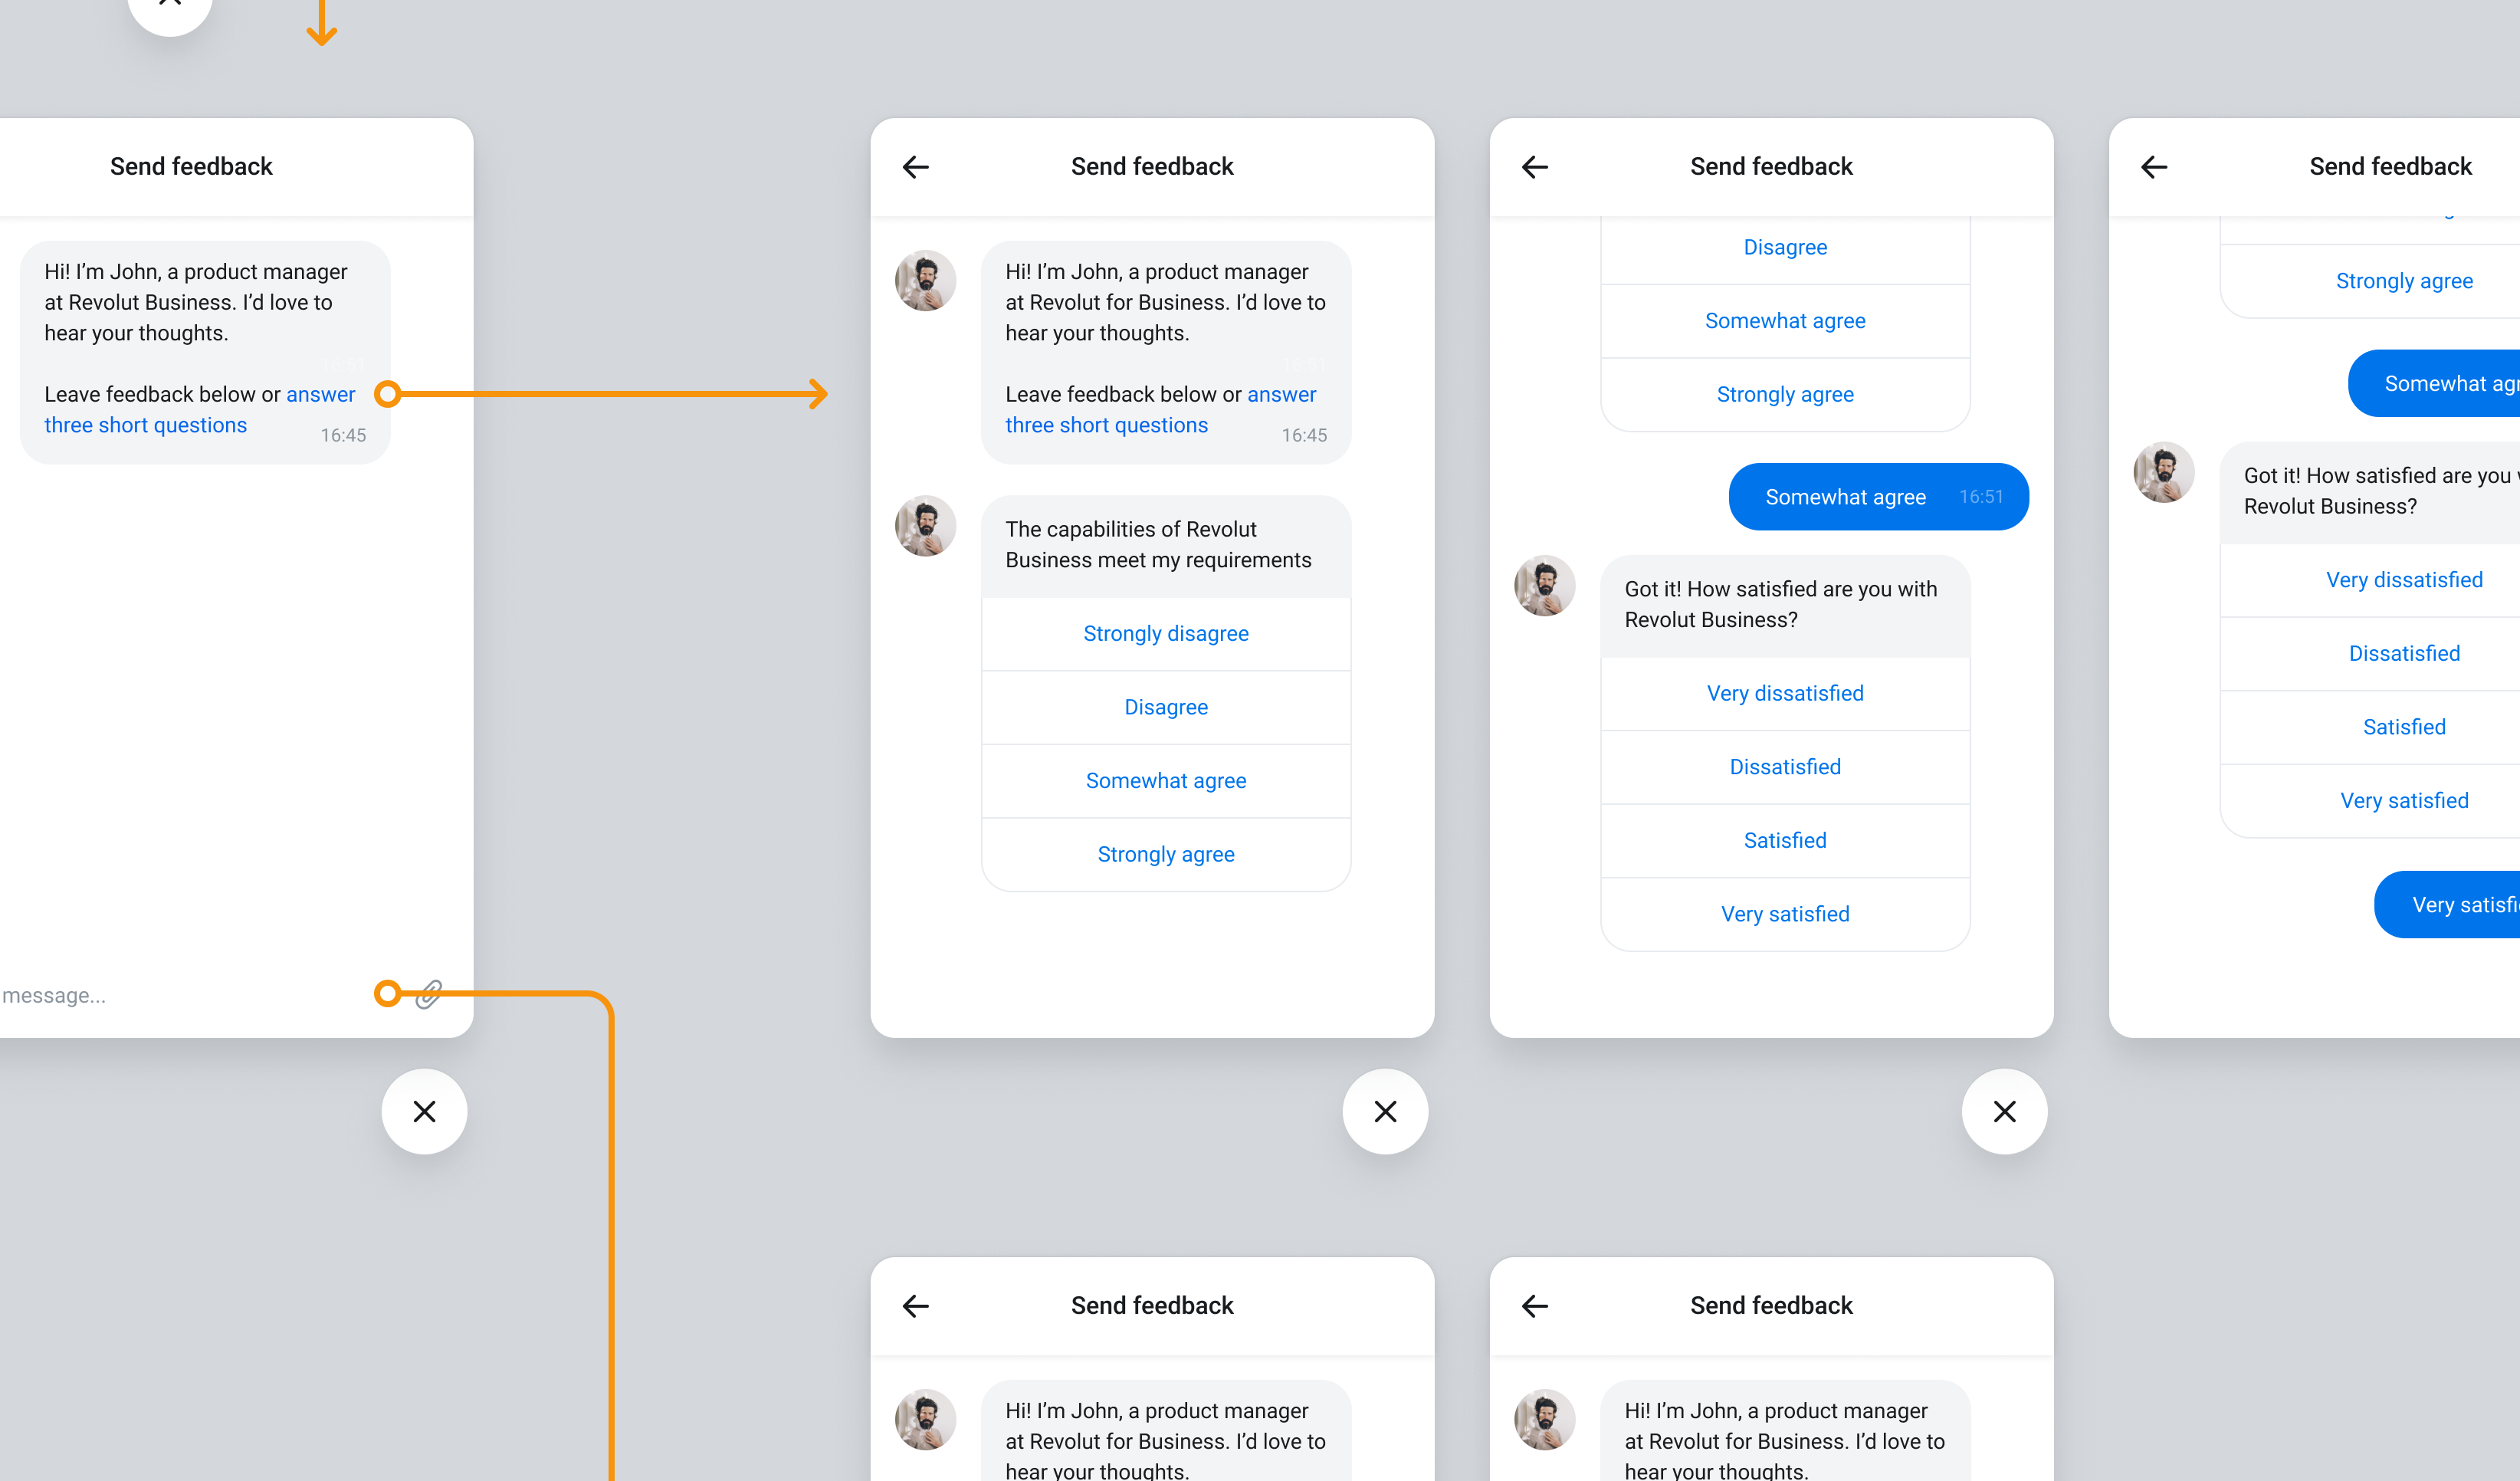
Exploration of the chat entry point
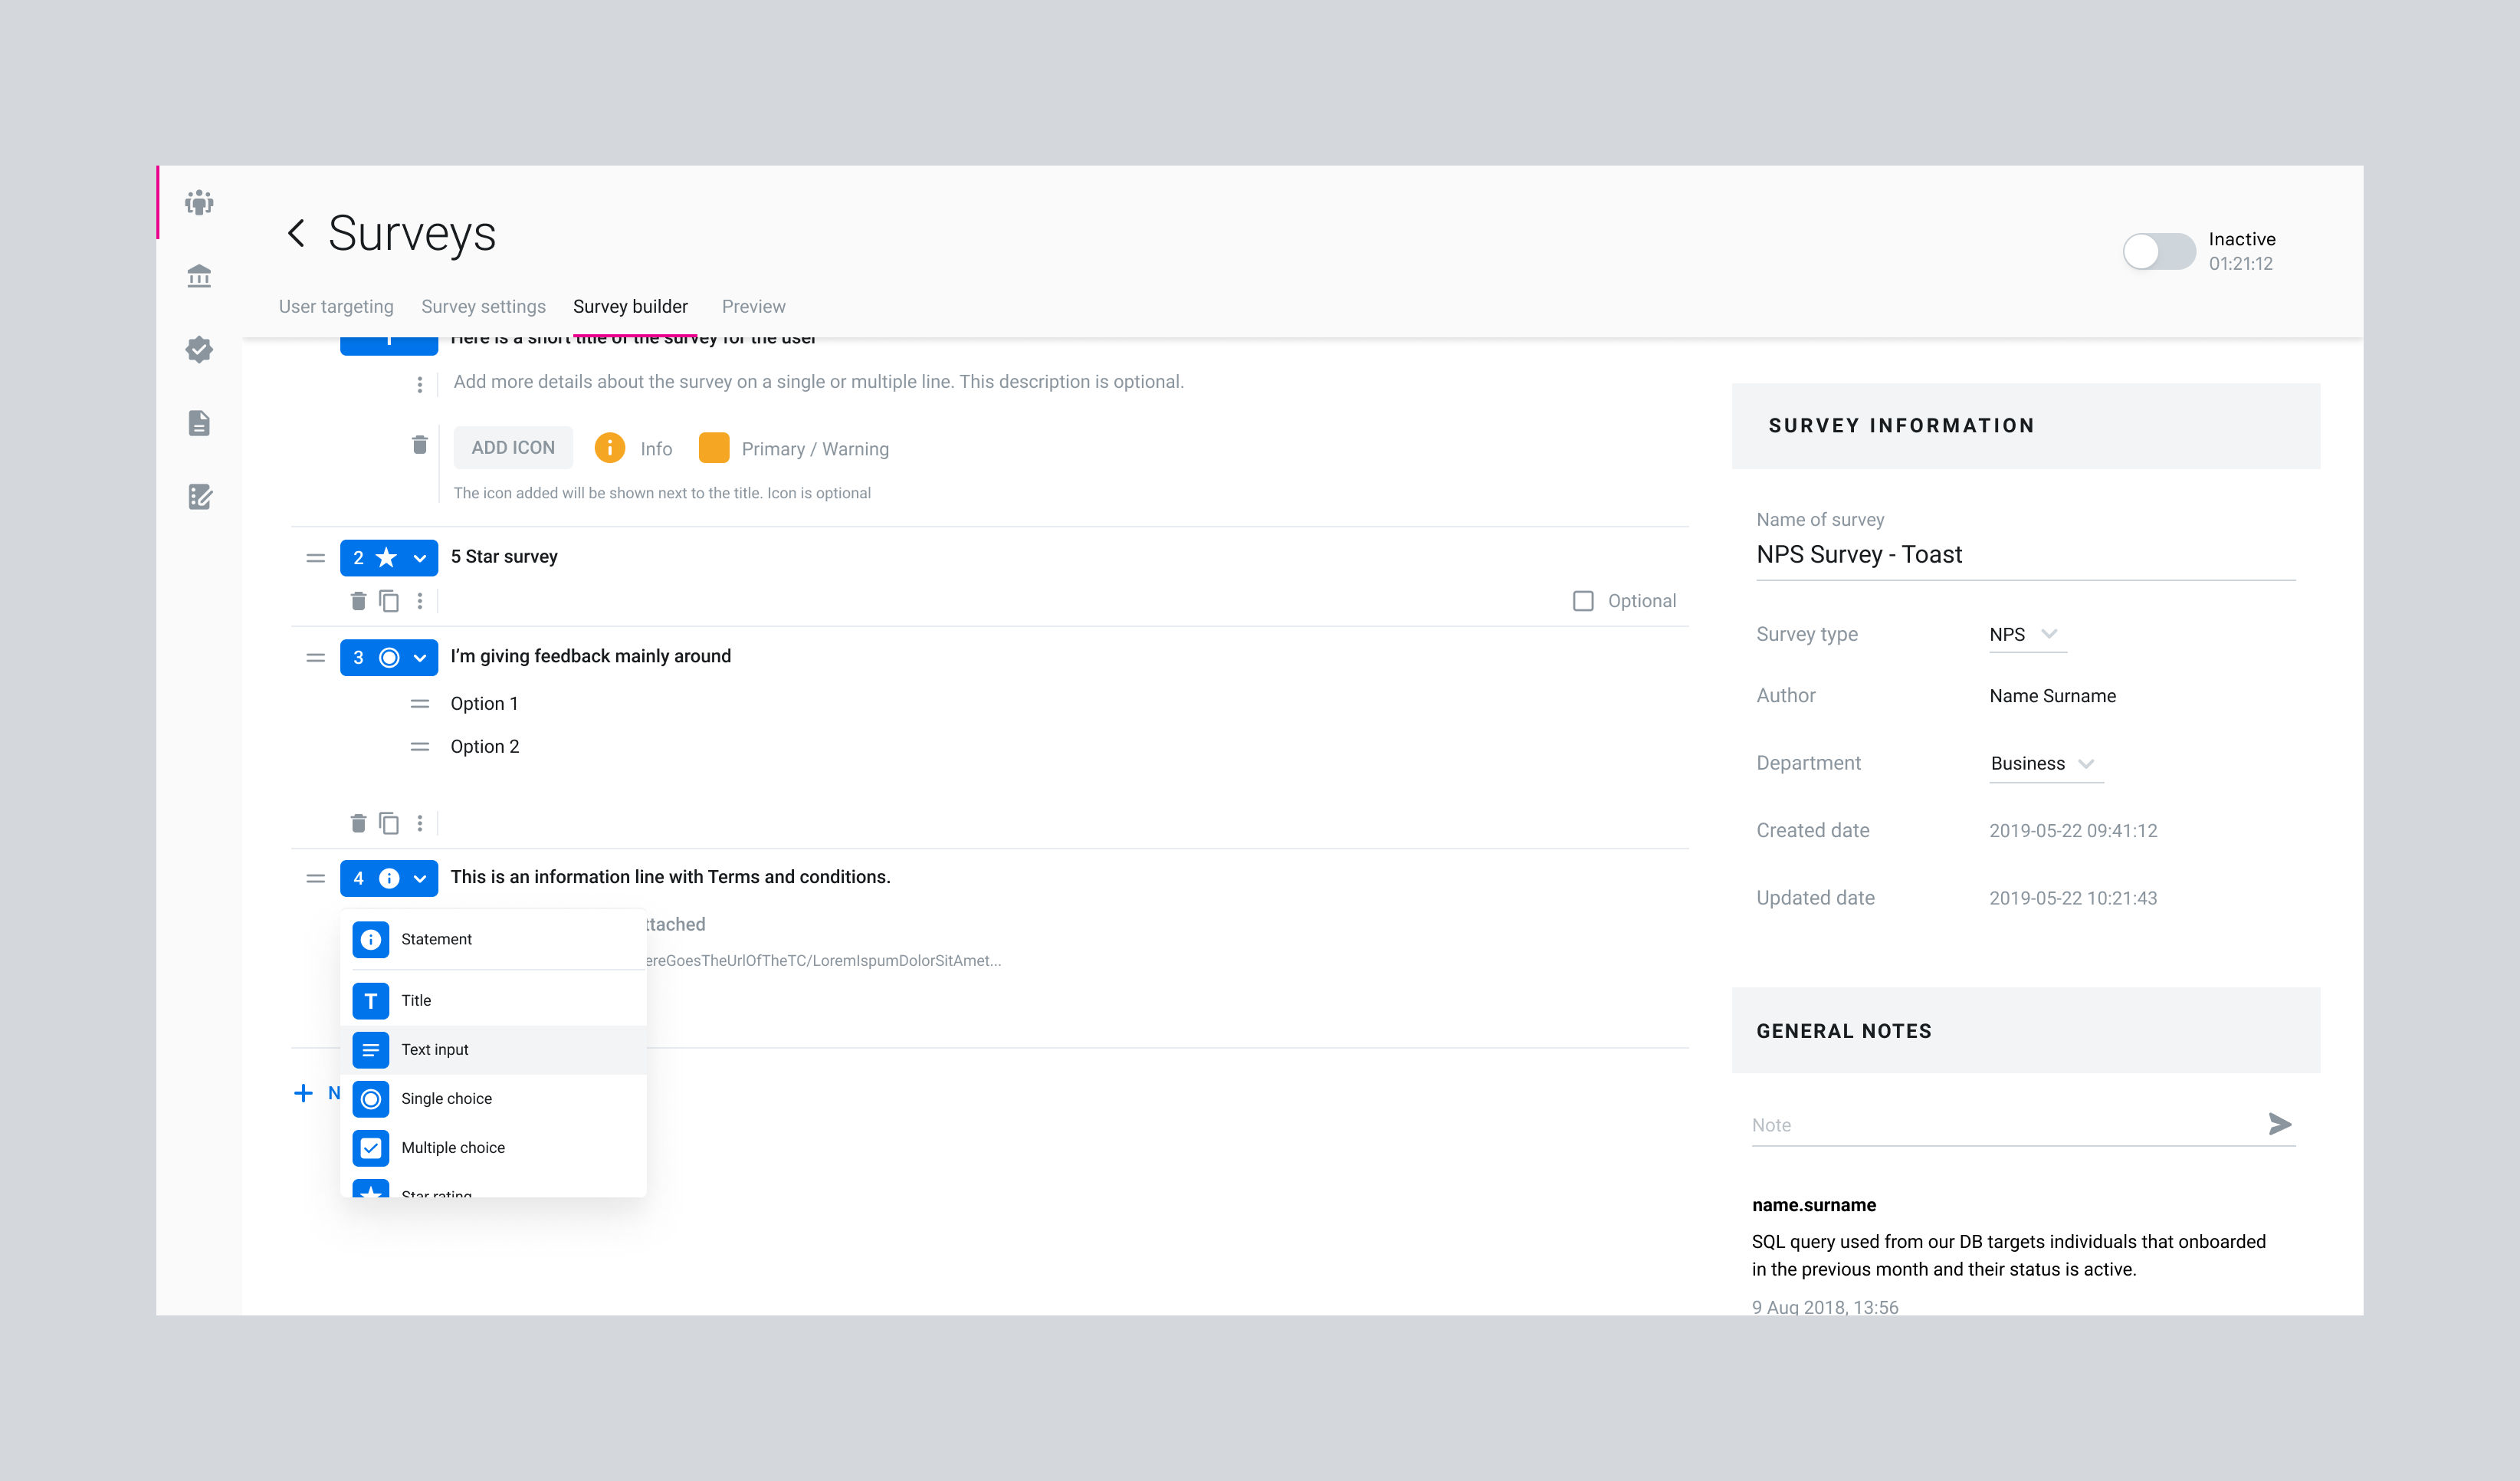
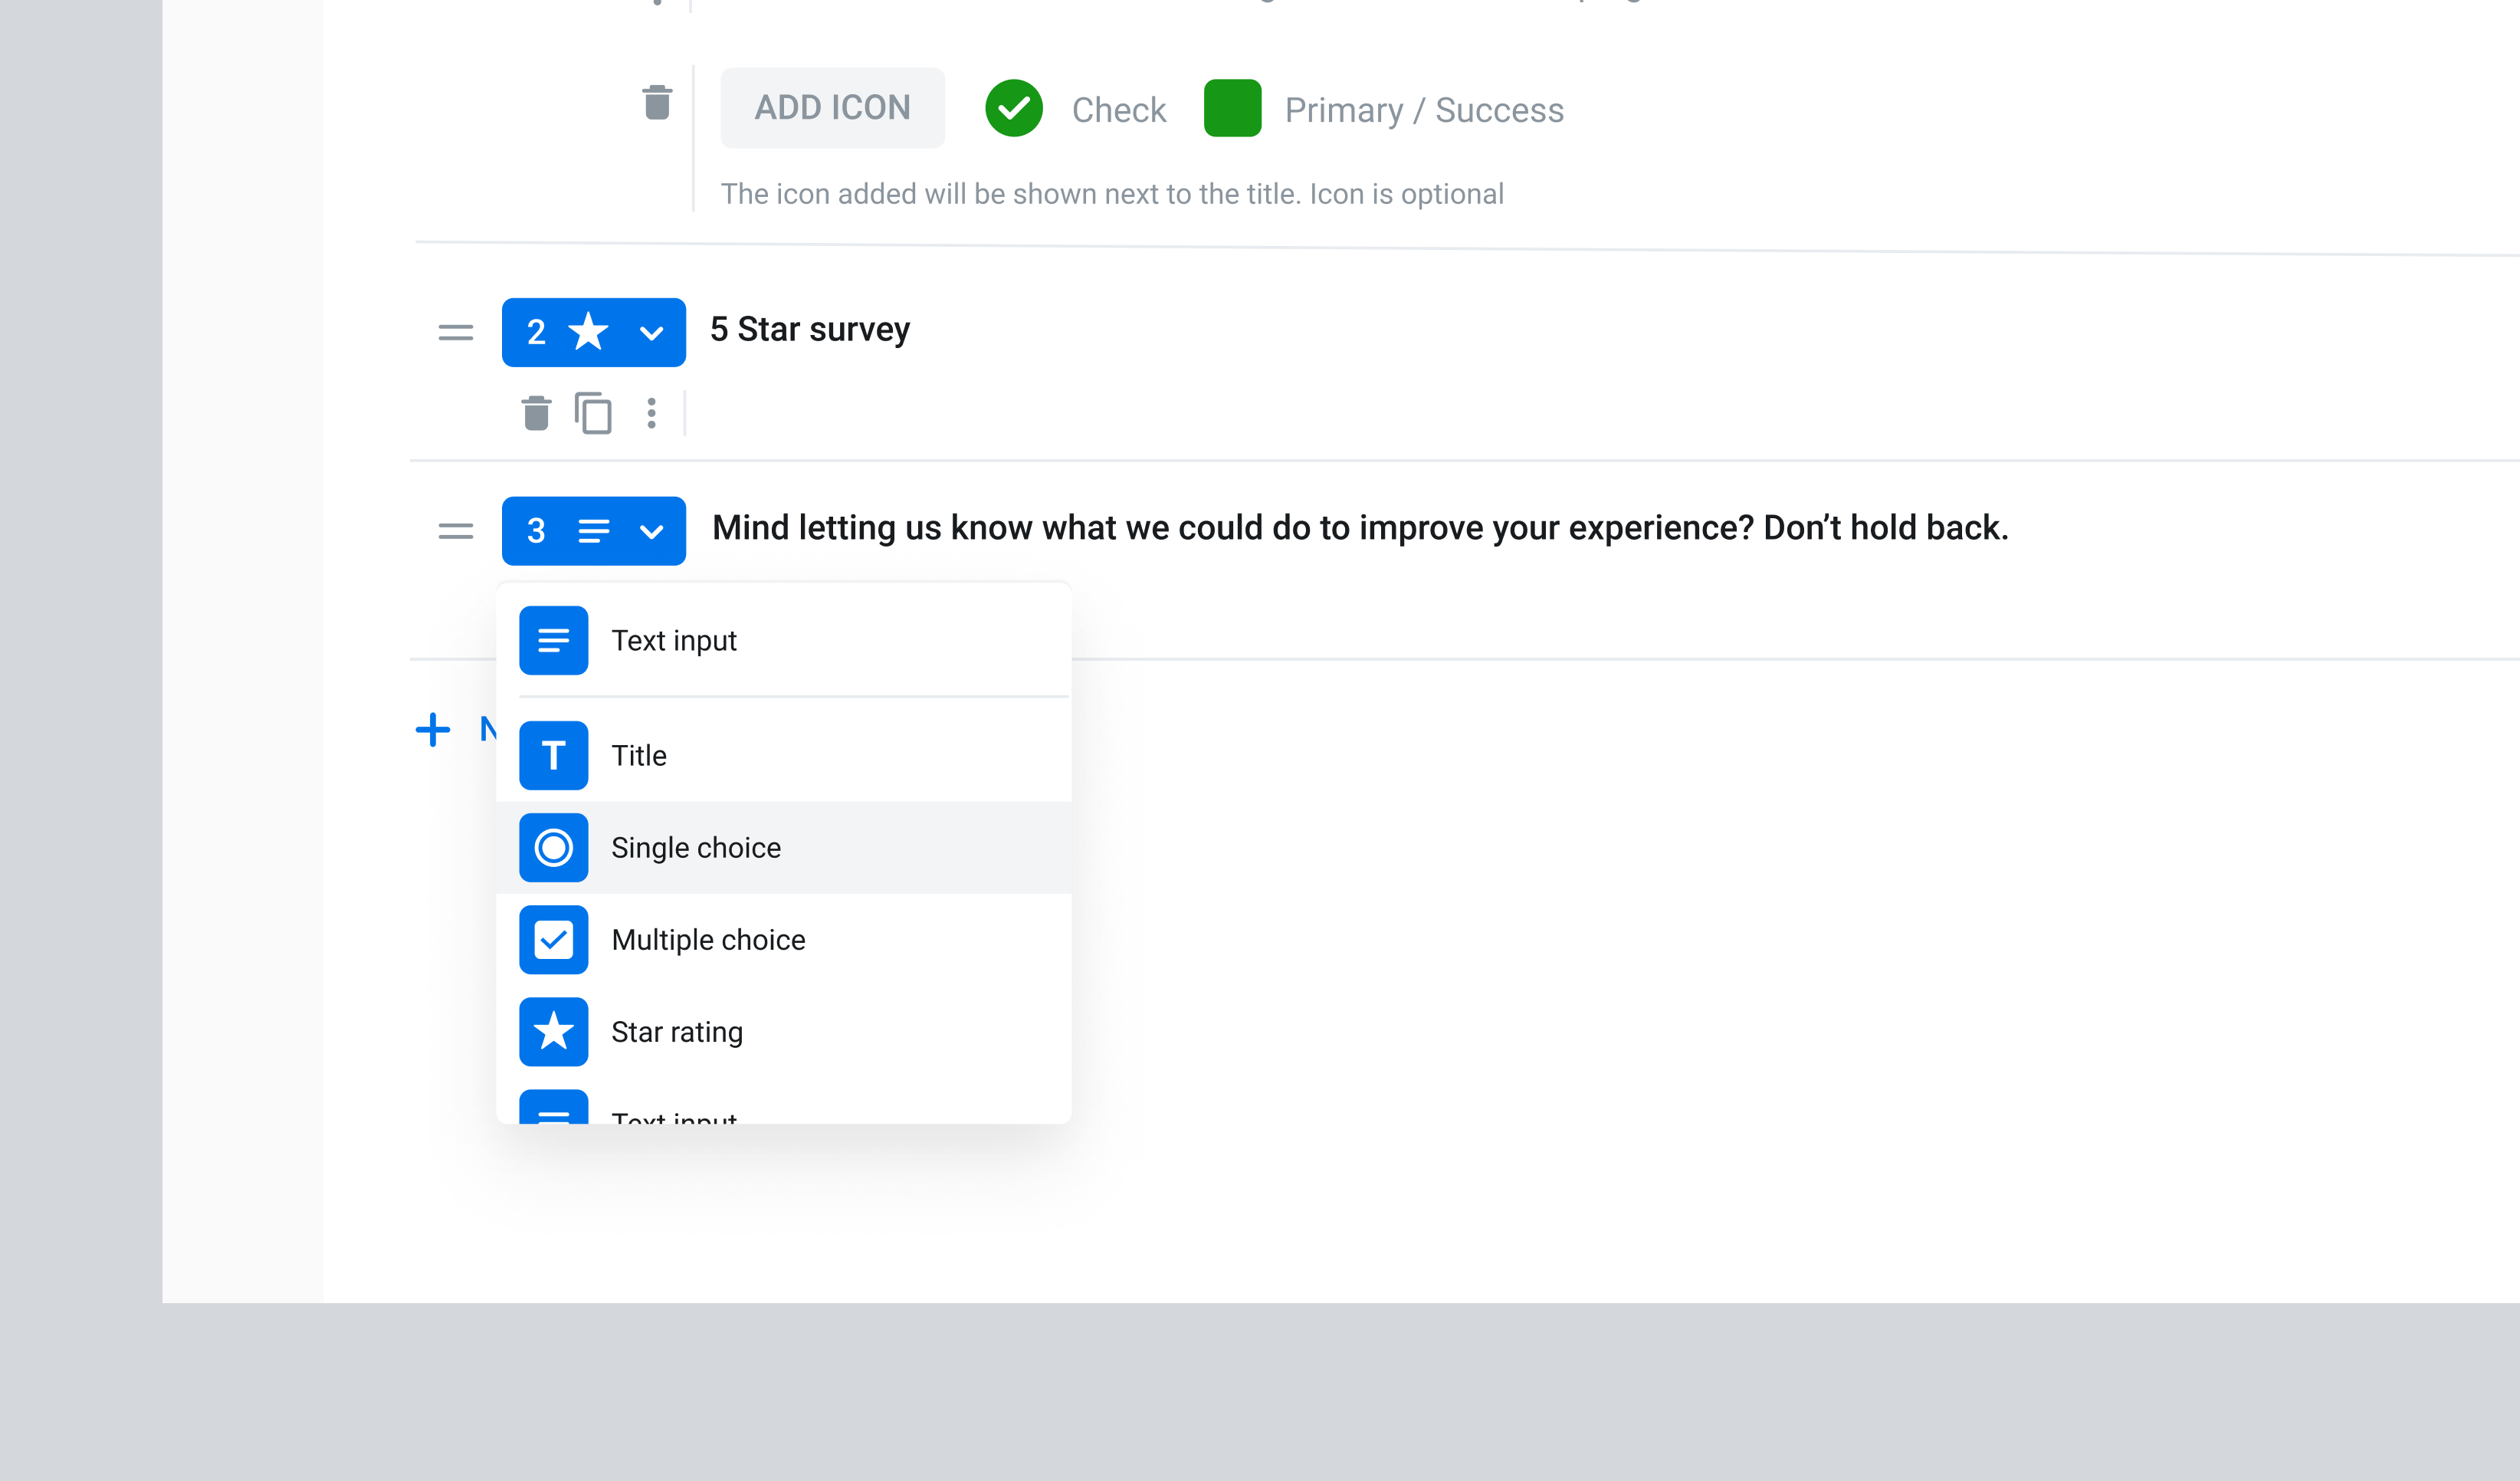
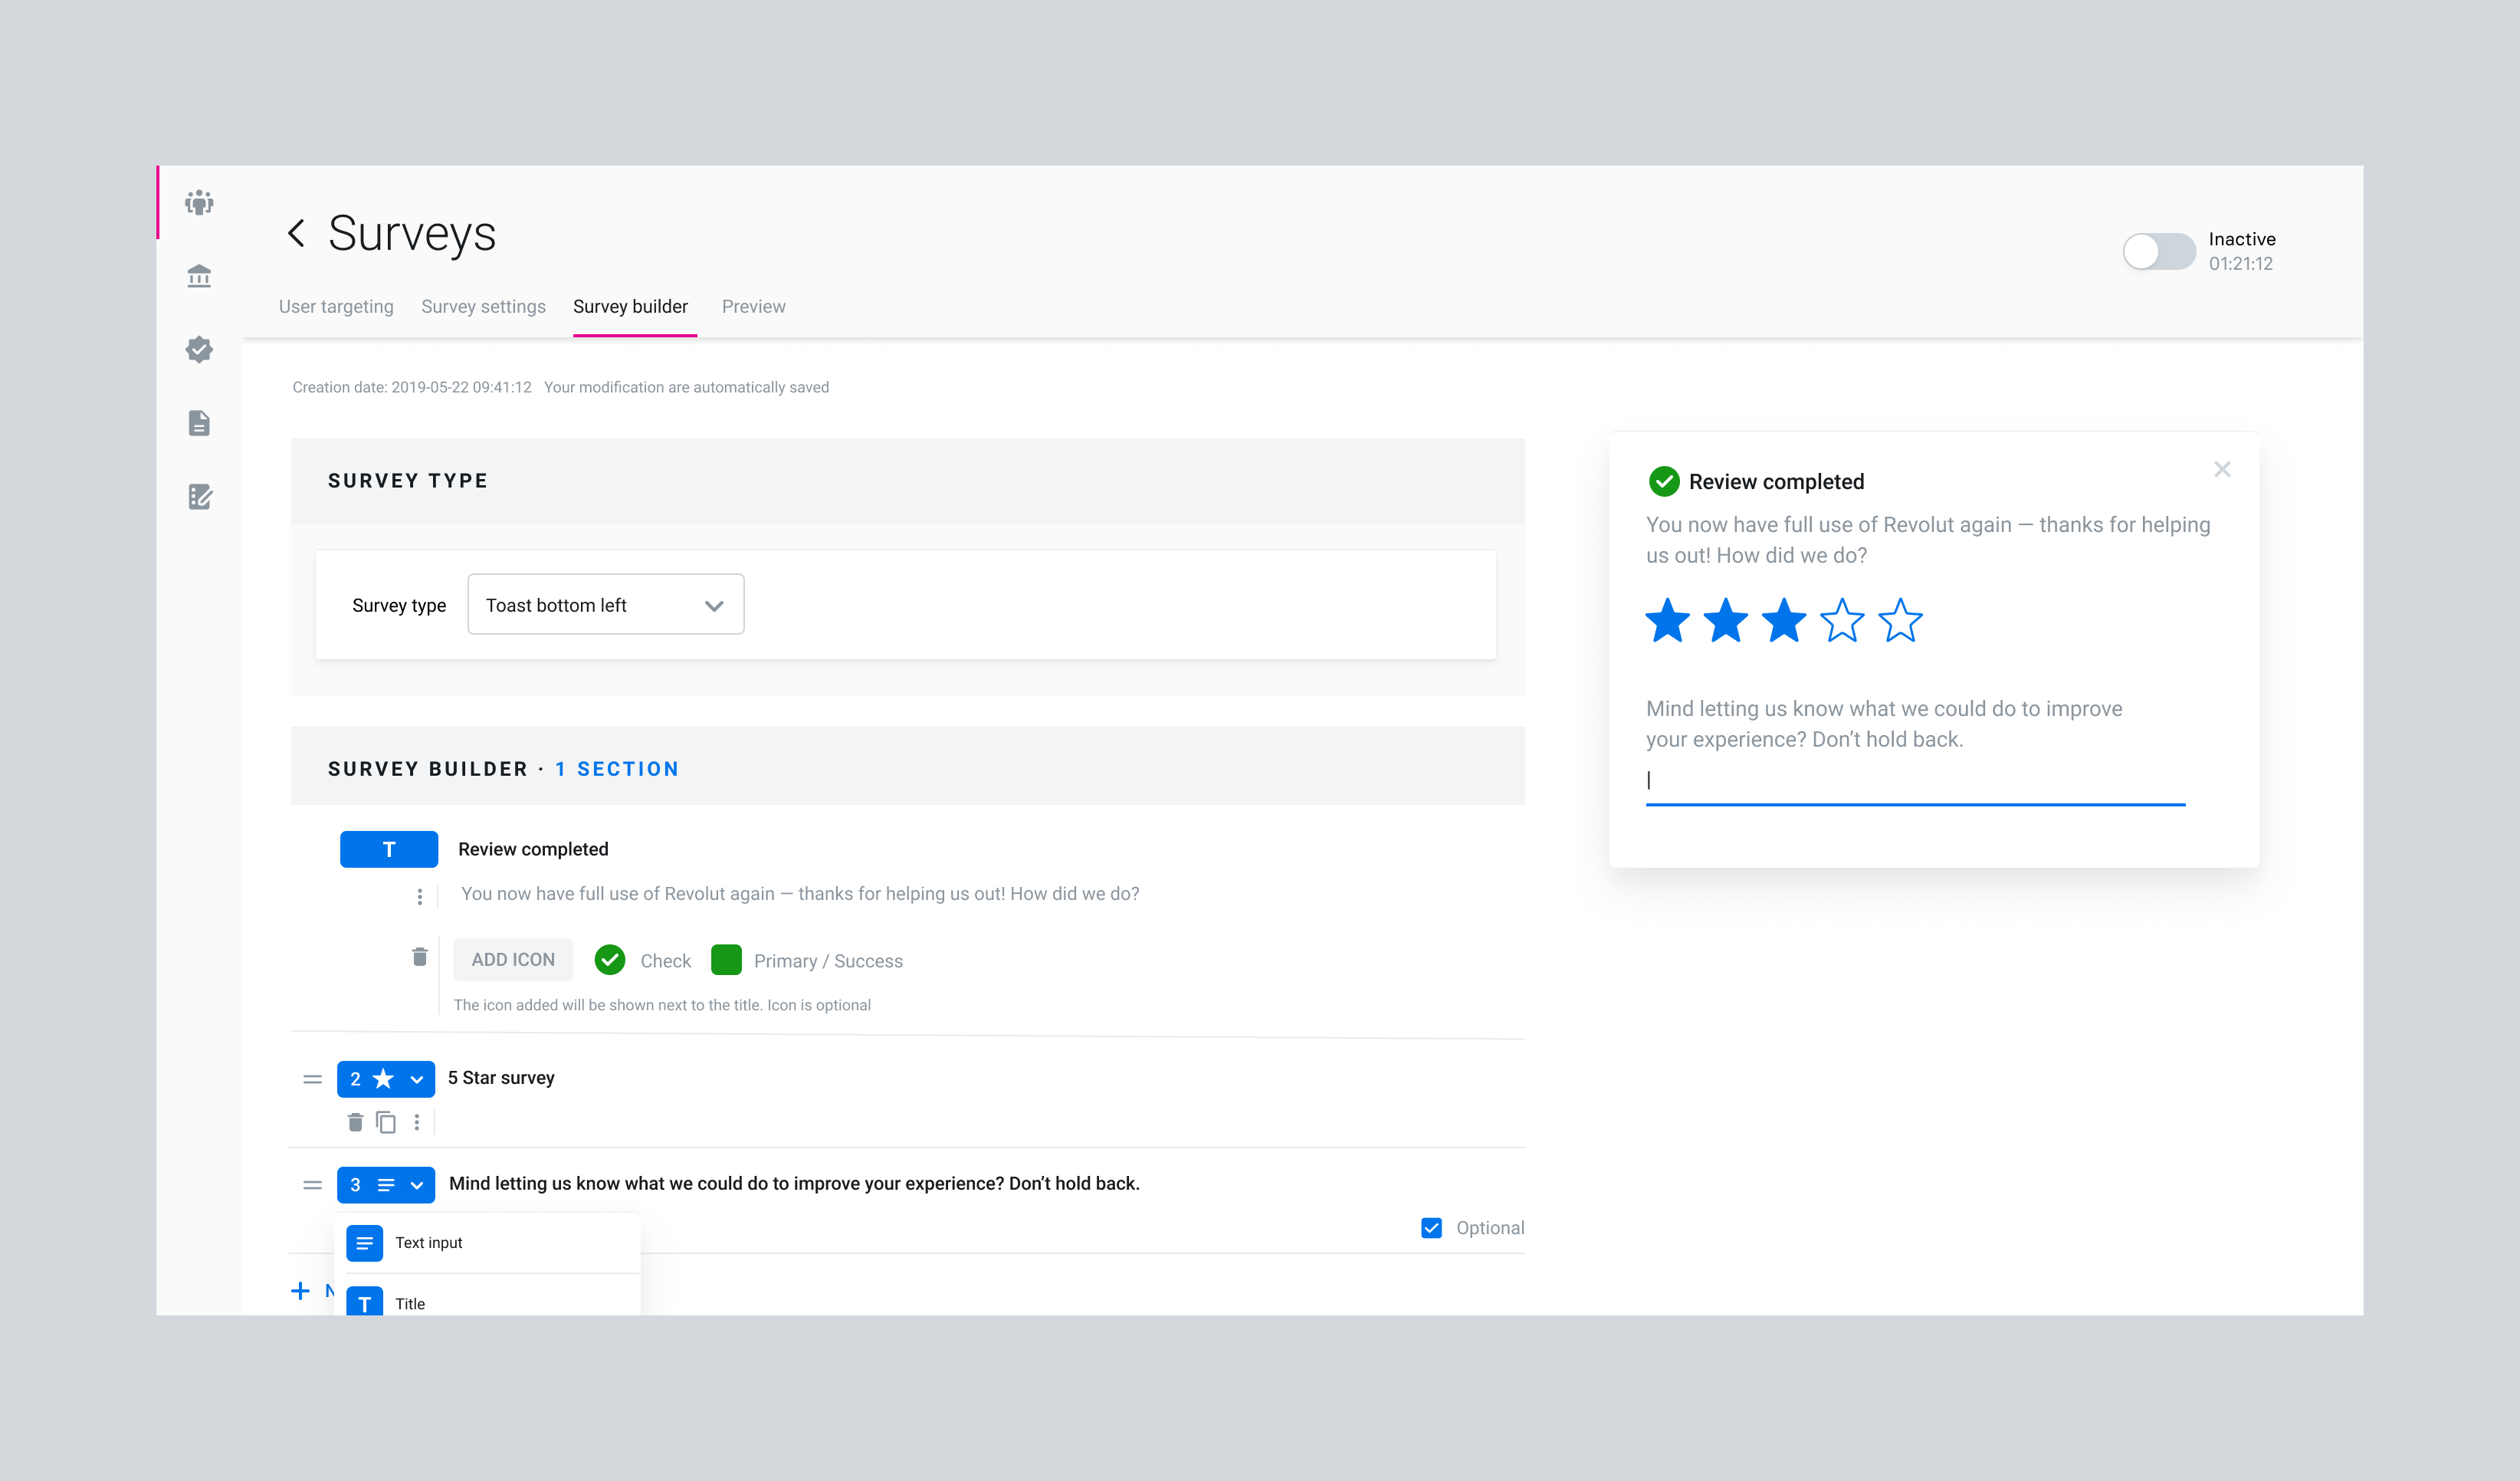
Survey Builder
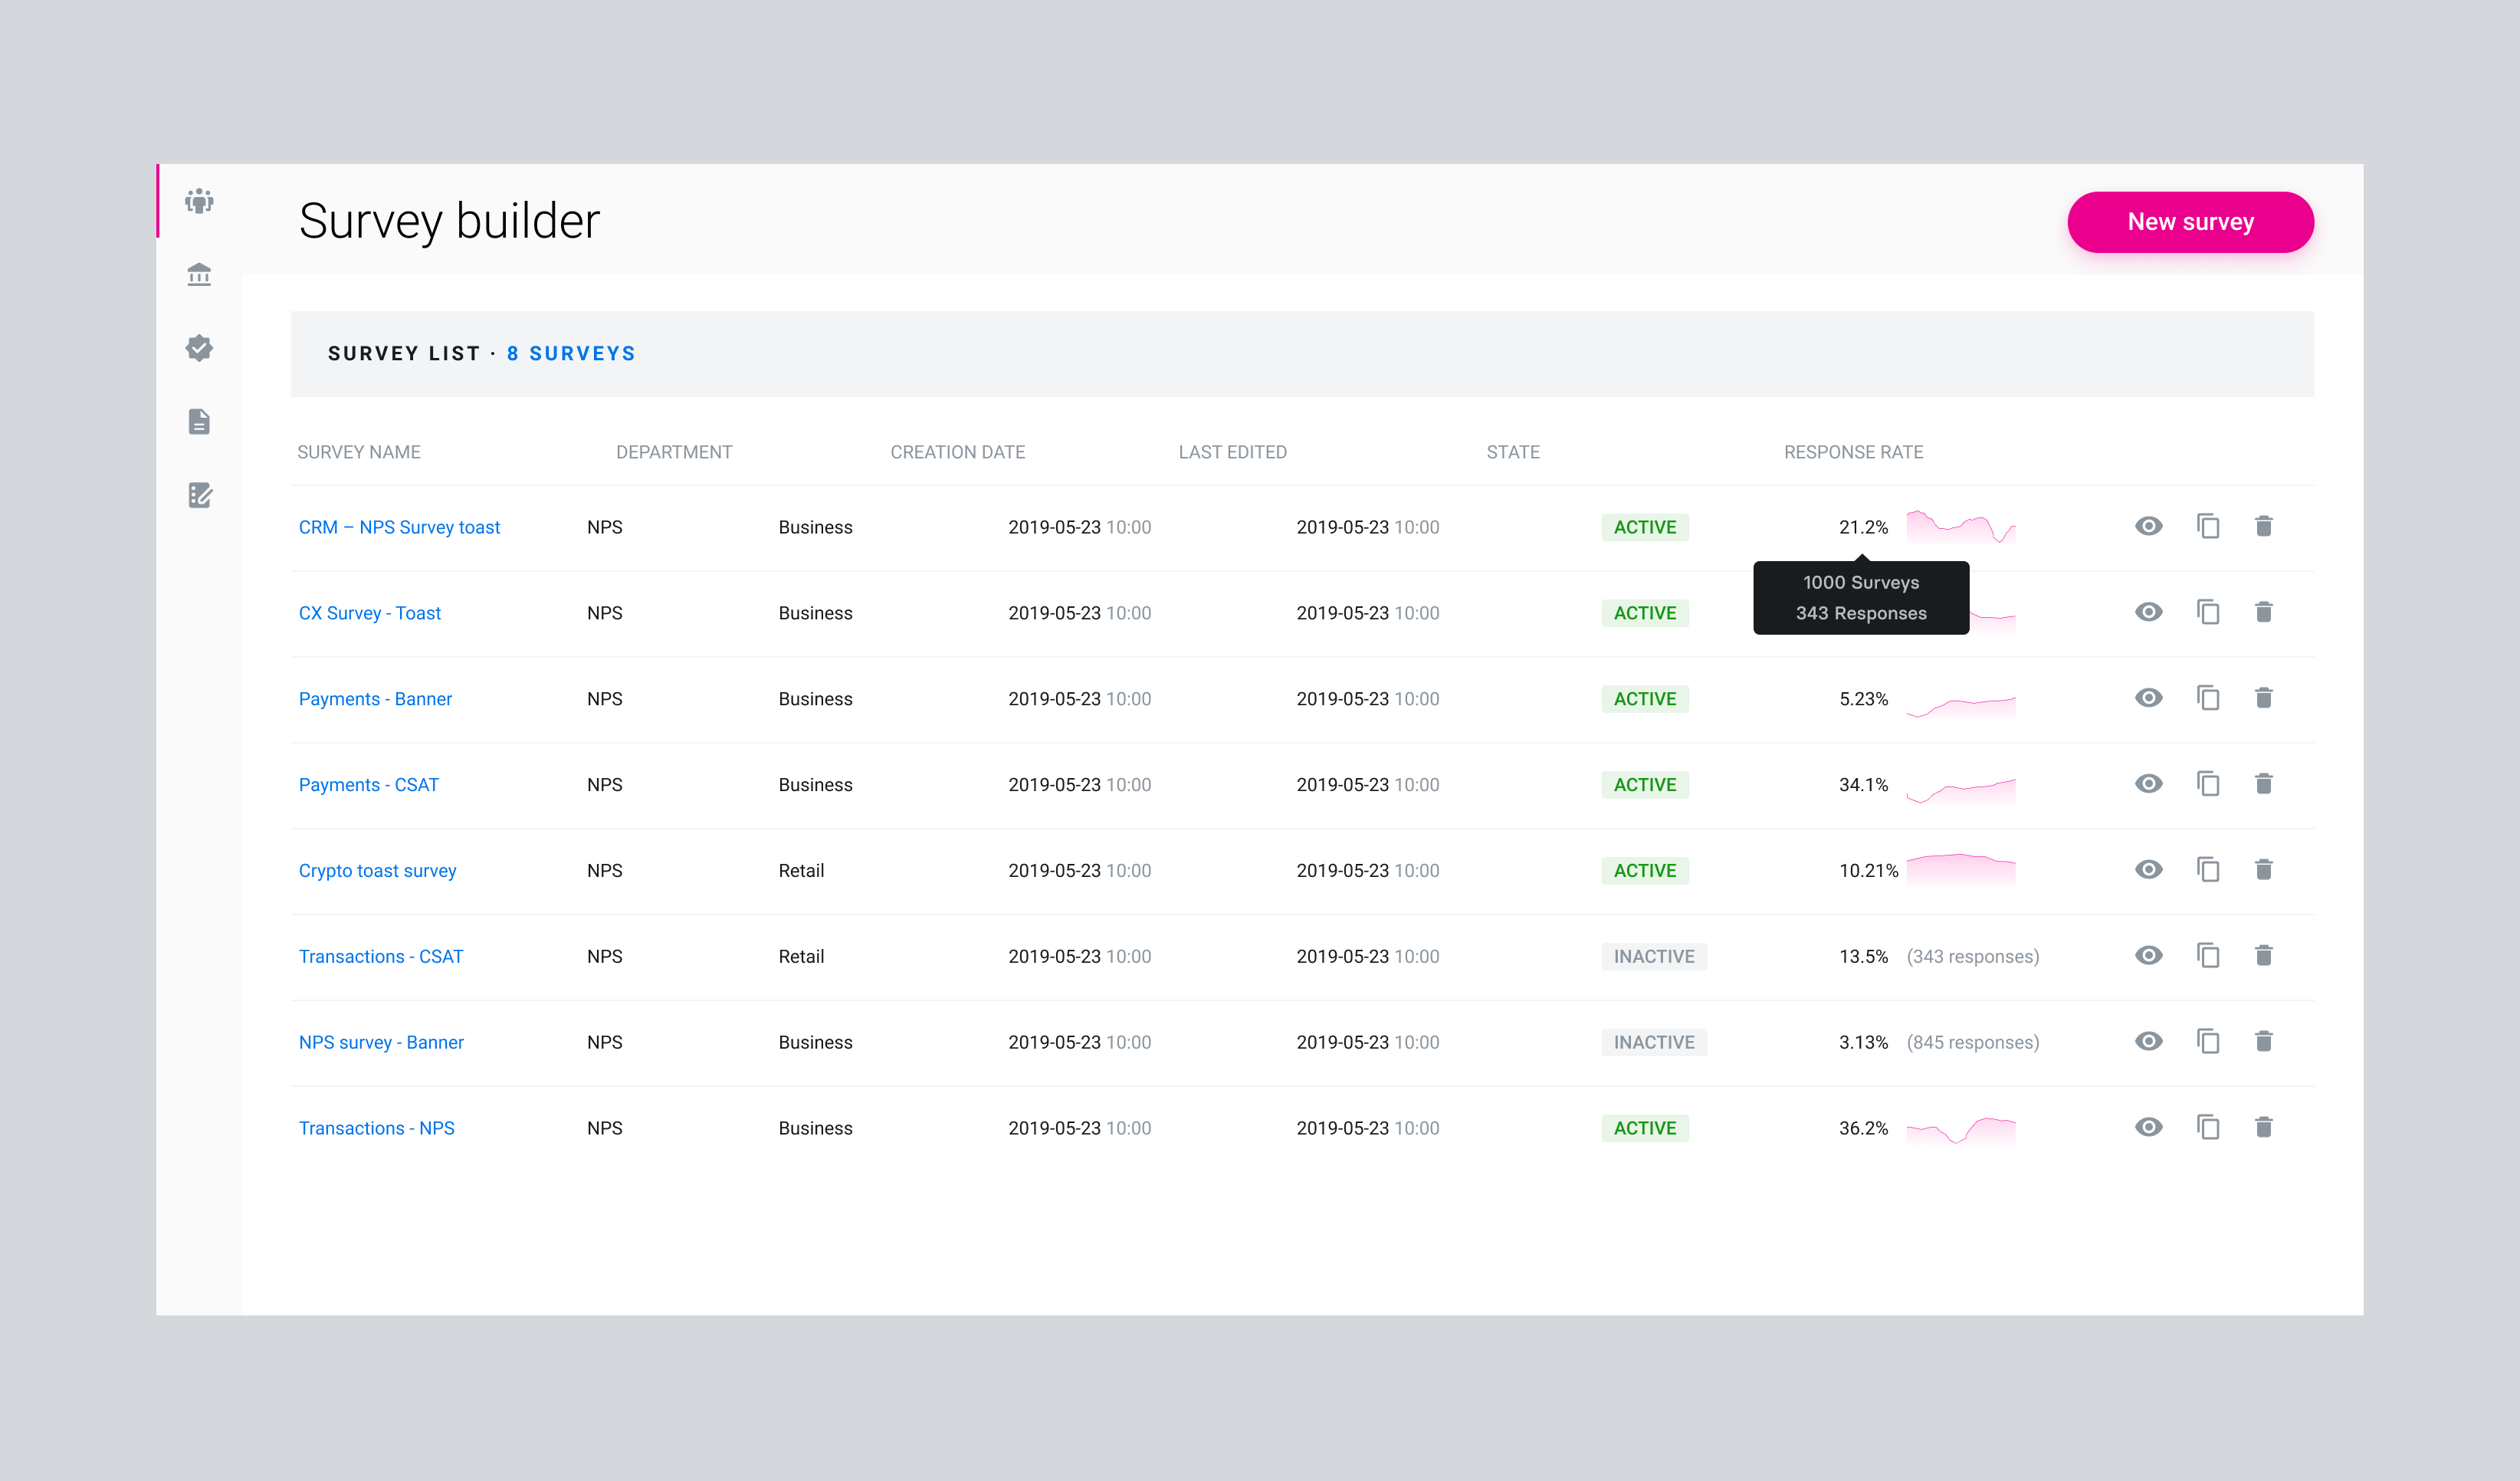
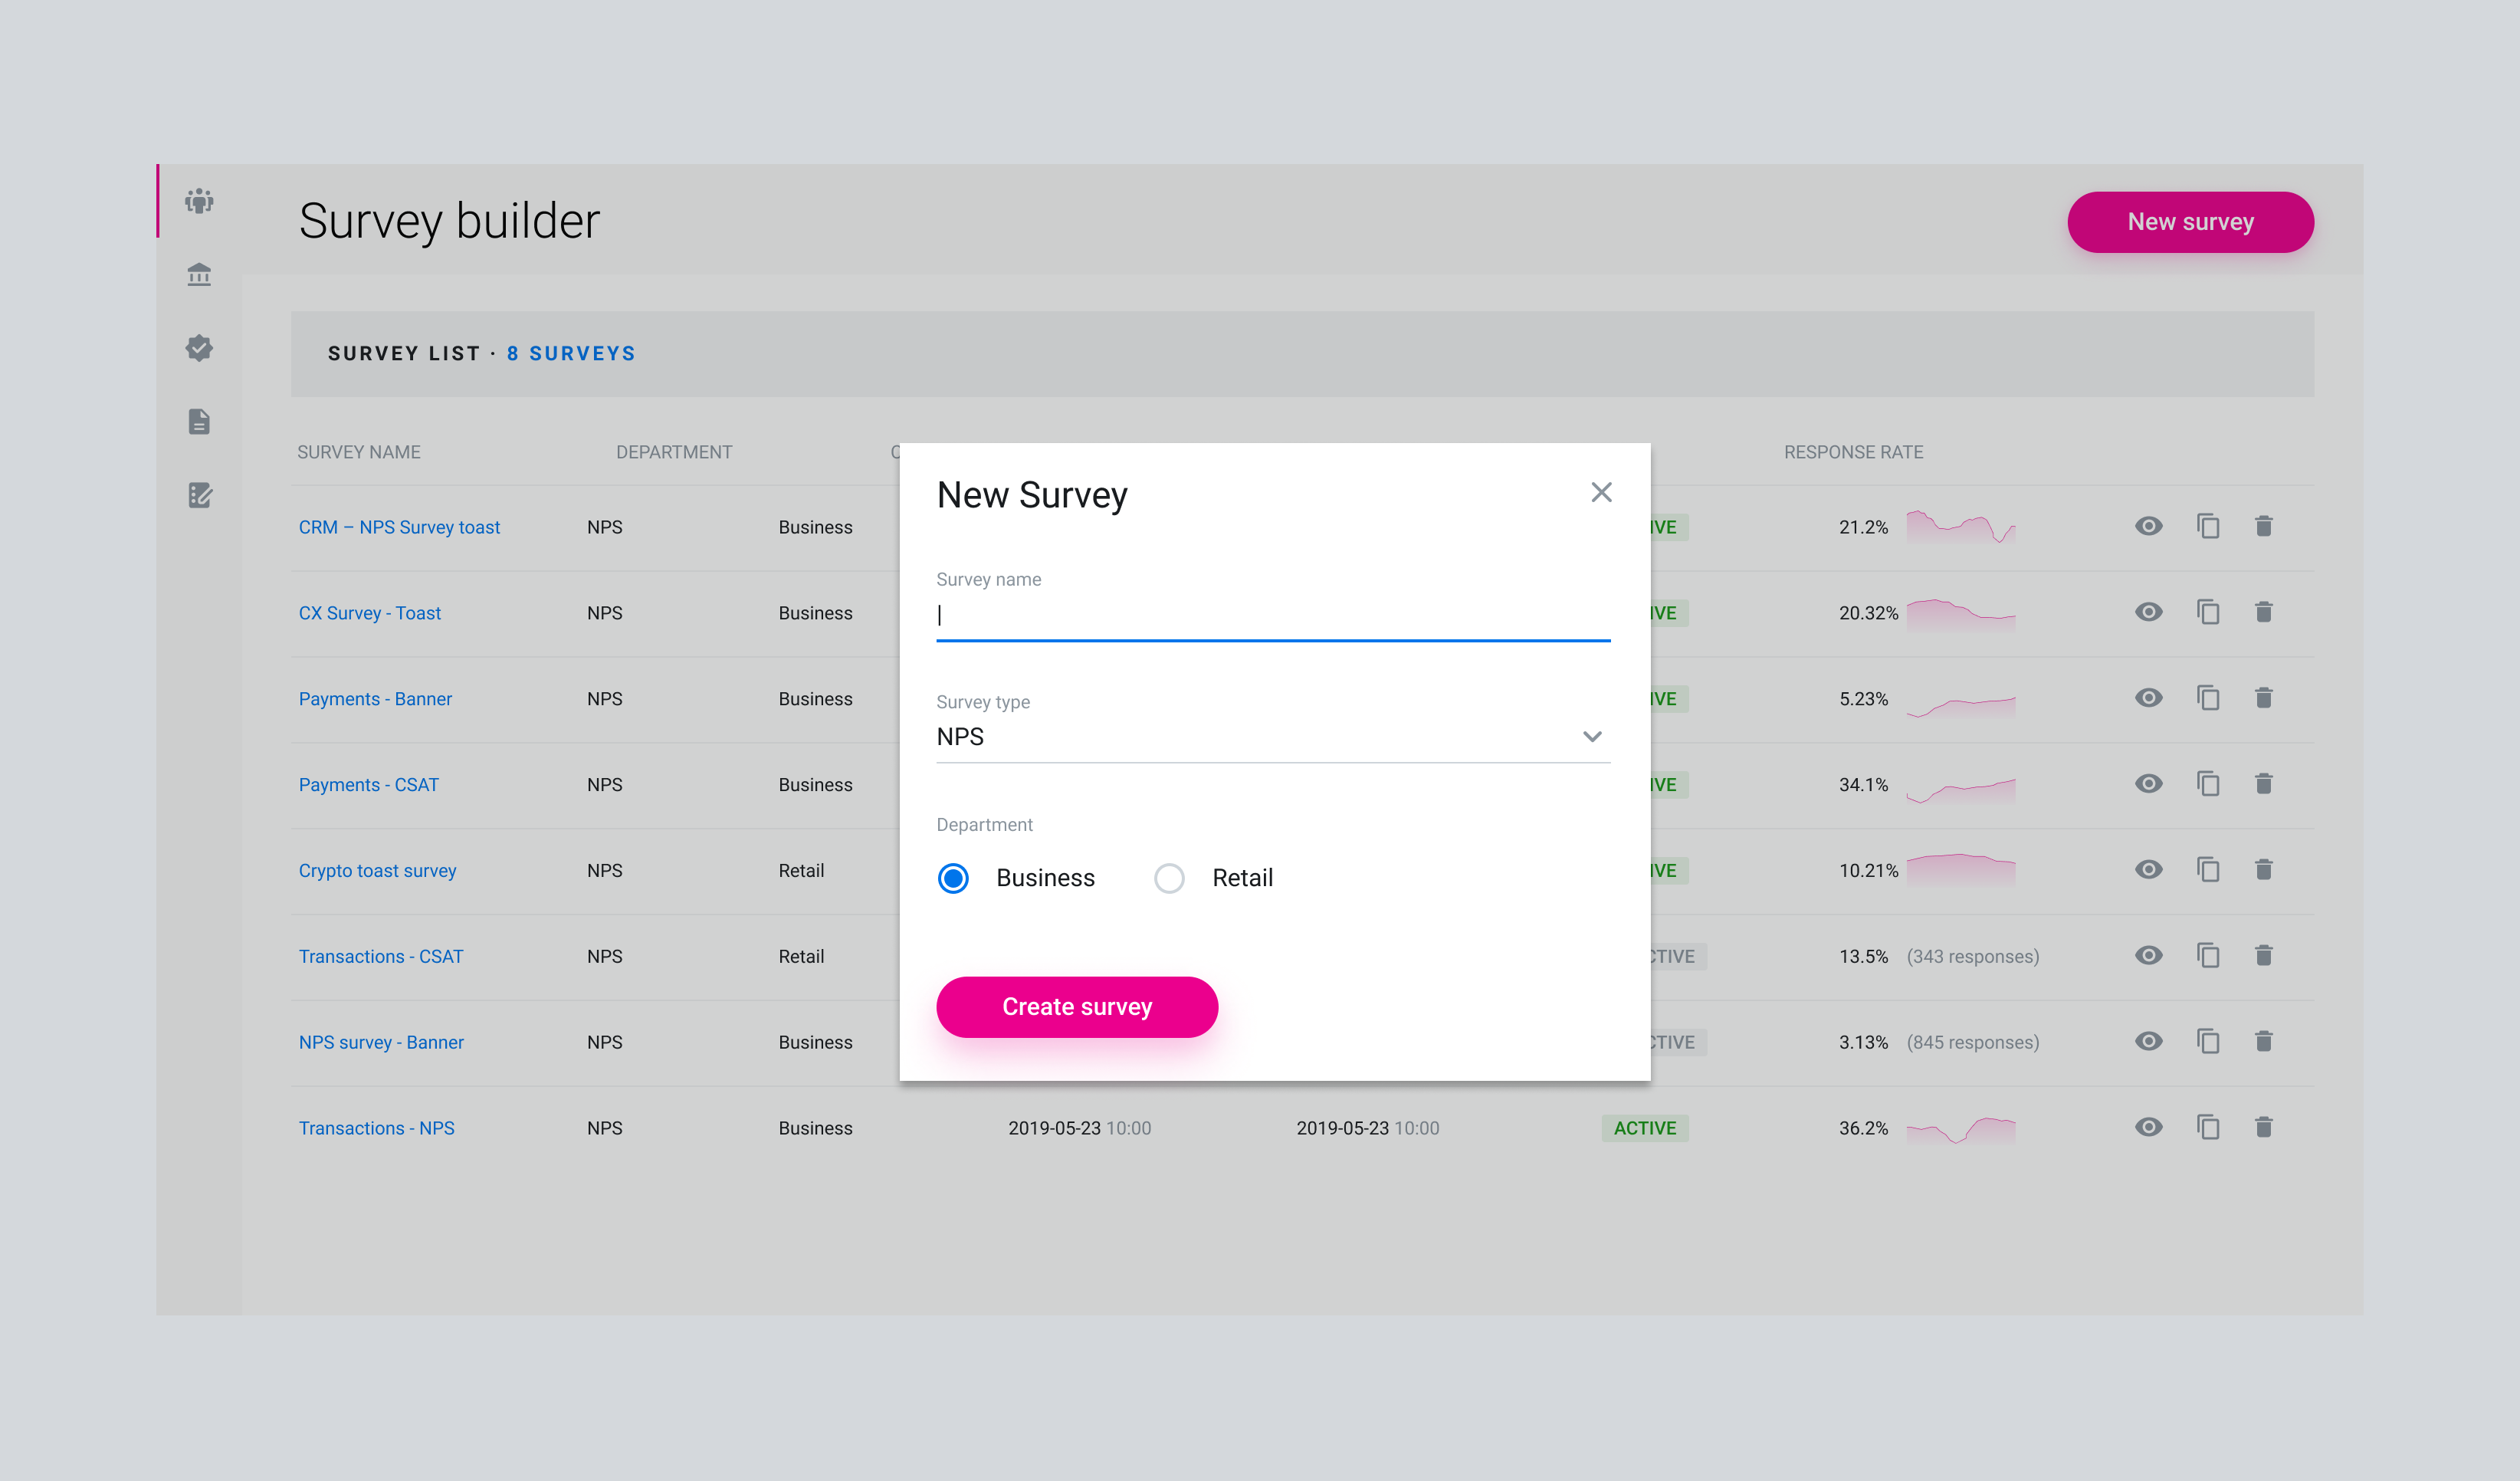
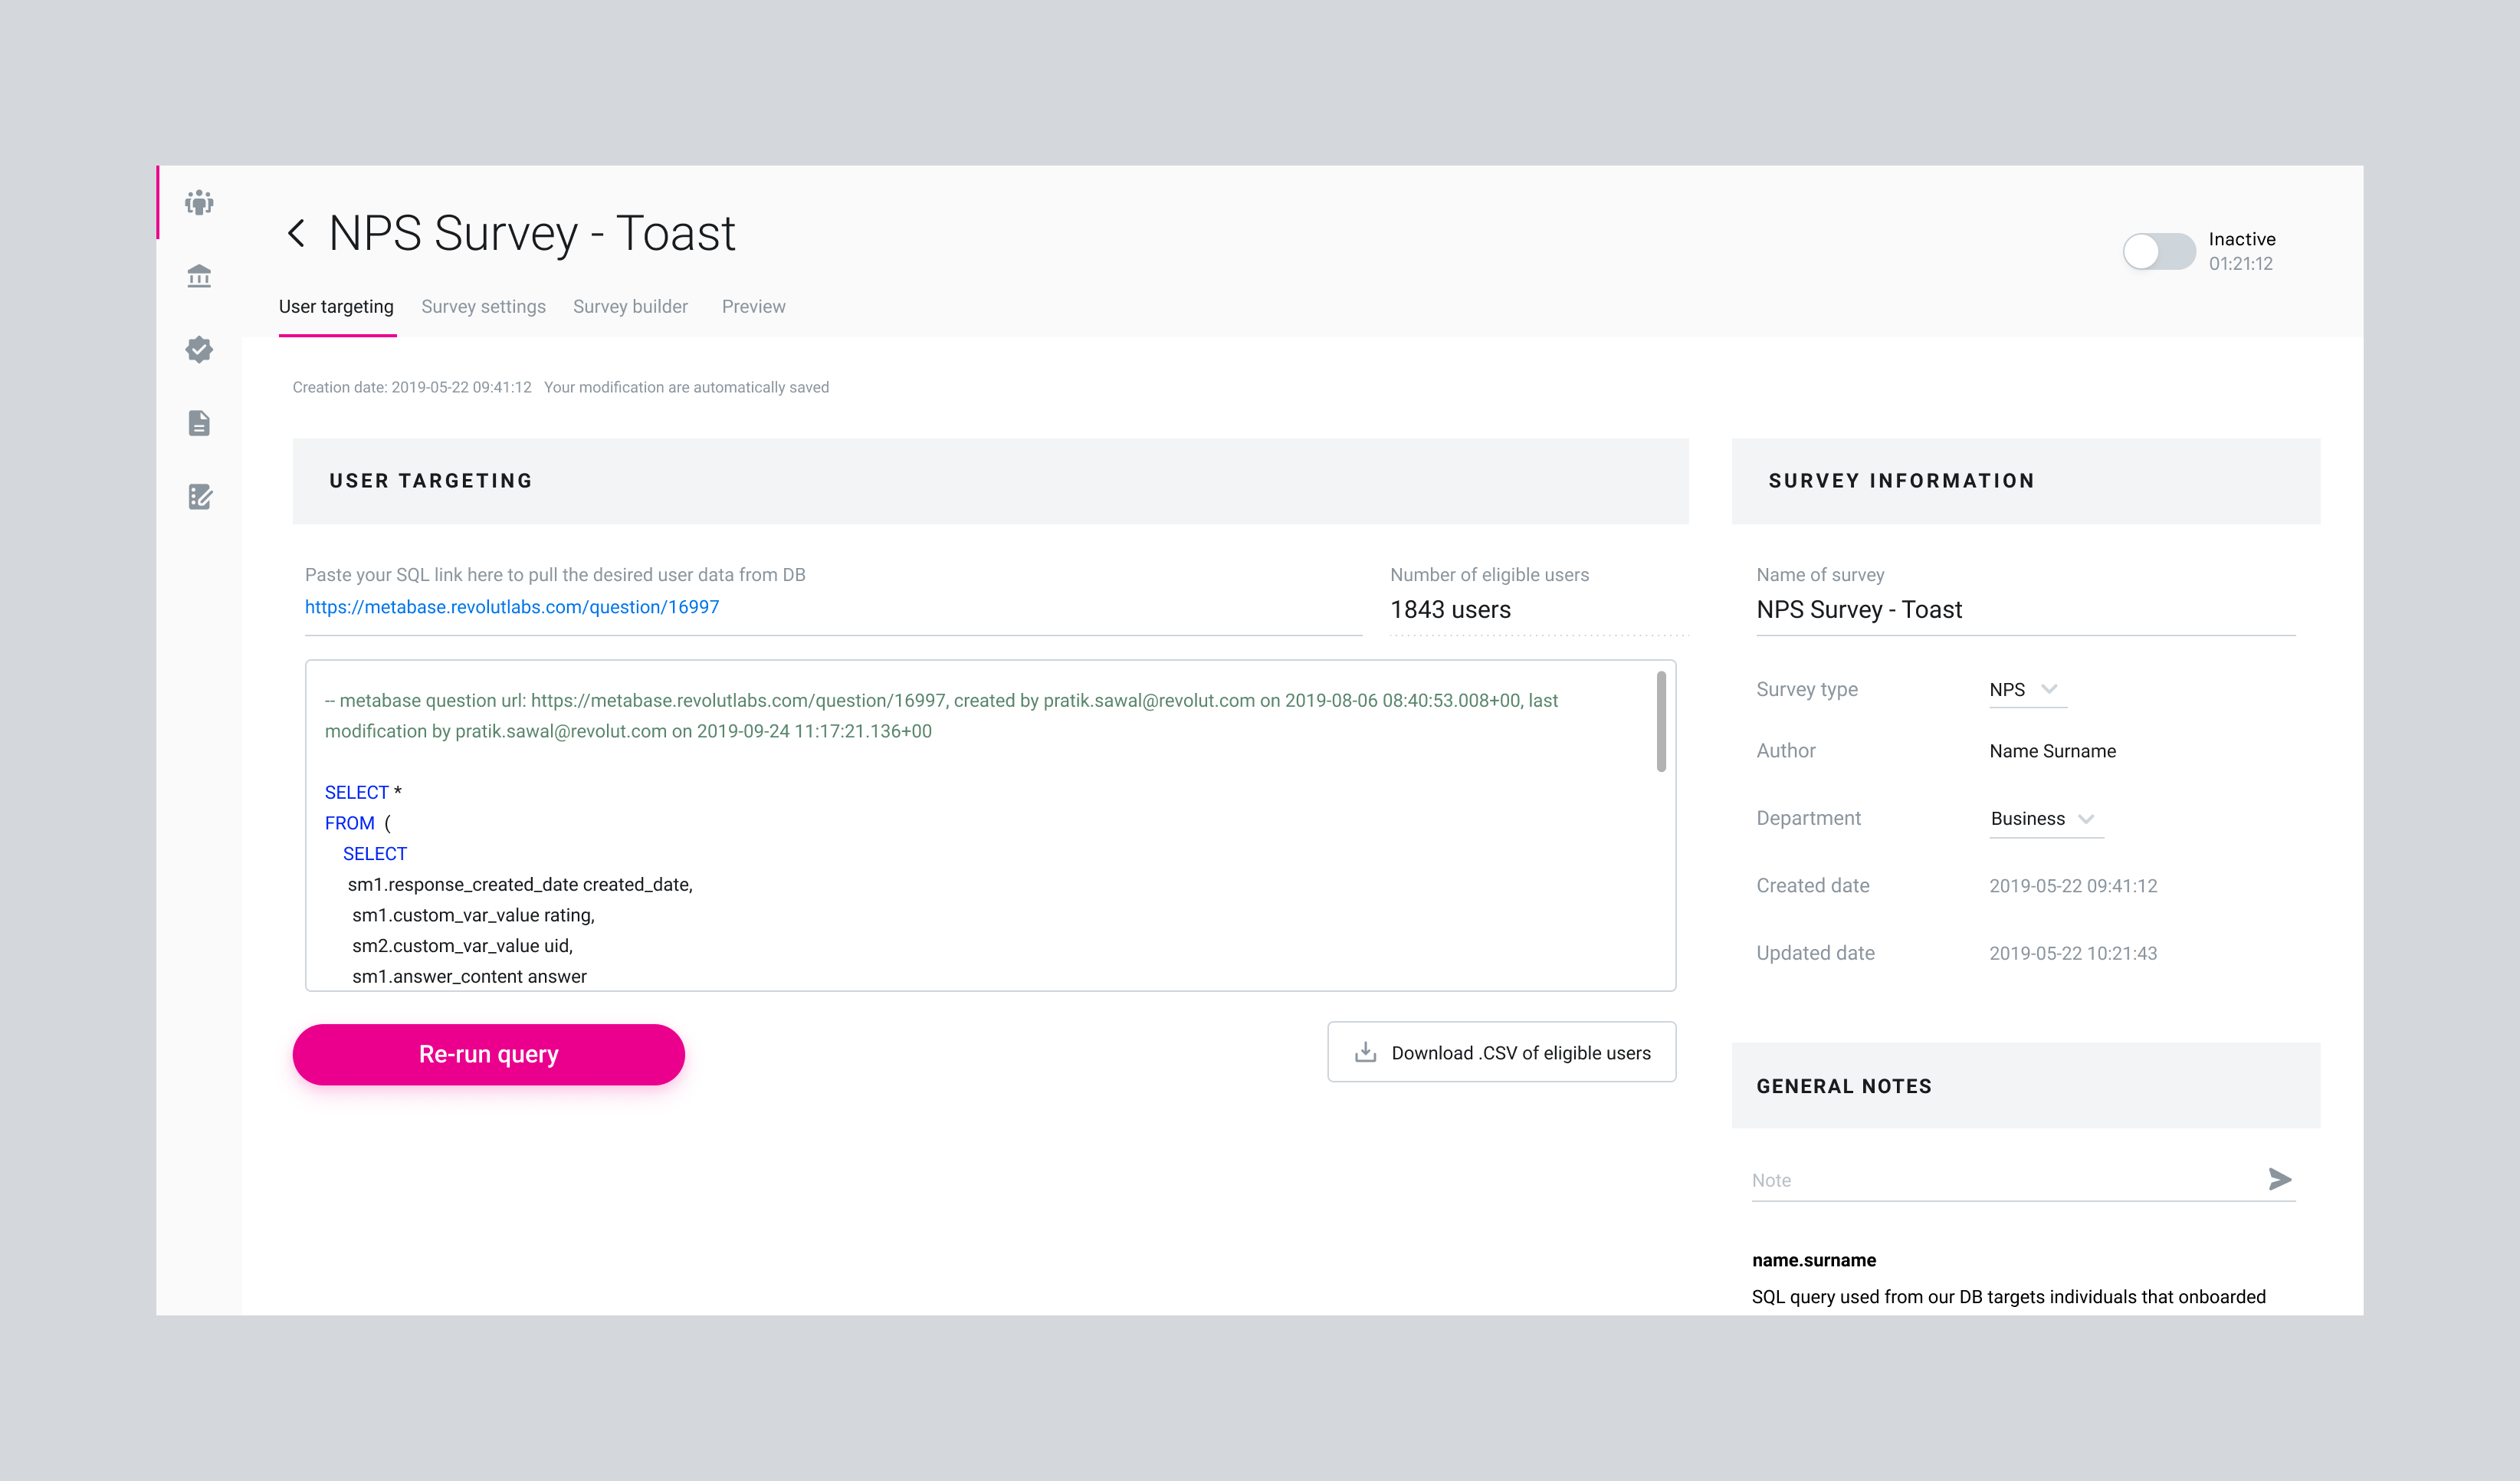
The goal for the survey builder was to implement a system in the back office that allowed other teams to build their own survey. The idea behind this was to avoid development effort and maintain design consistency throughout the whole UI.
Since both the banner and the toast survey showed good results, the survey builder gives the option to choose between the two types.
My task was to design the back office experience and the user interface.
Conclusion
We managed to achieve great NPS results and managed to successfully test the hypothesis. Both tests were successful. NPS score was increased from 25.7 to 56.1. It was also concluded that the response rate baseline of the web-app banner was ~20%, and the response rate for the web-app toast was ~35%.
The project's biggest challenge was the back office. In a tight timeframe, I had to sync with multiple teams to understand how they are distributing their survey, make sure that the platform supports any option they need, and is easy for anyone to use. During this project I worked on a variety of platforms including mobile web, native app, and web-app.
